Changelog

Follow new updates and improvements to GoCSM.

🚀 New Feature Release: Embeddable White-labeled Customer Account Activity Center

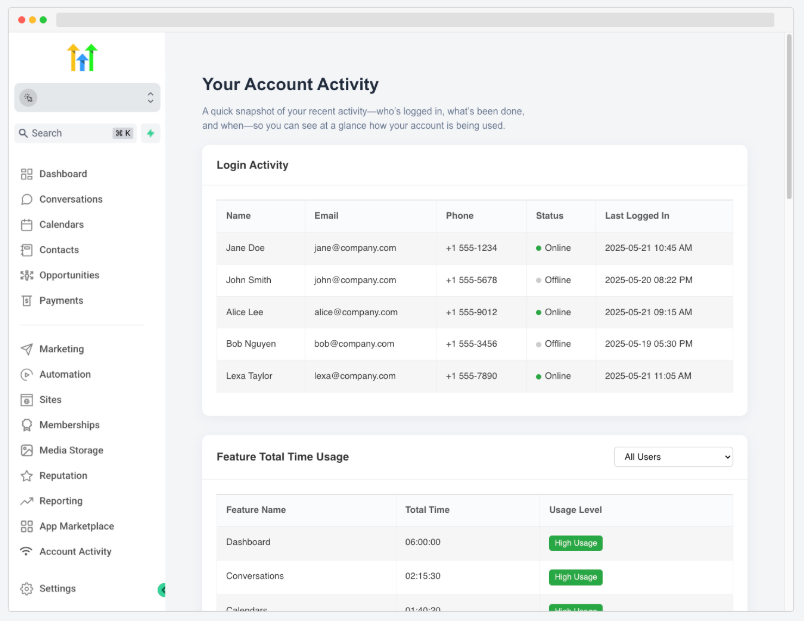
Now you can give your clients full visibility into their own account usage—right inside your HighLevel dashboard.
🌟 What’s New:

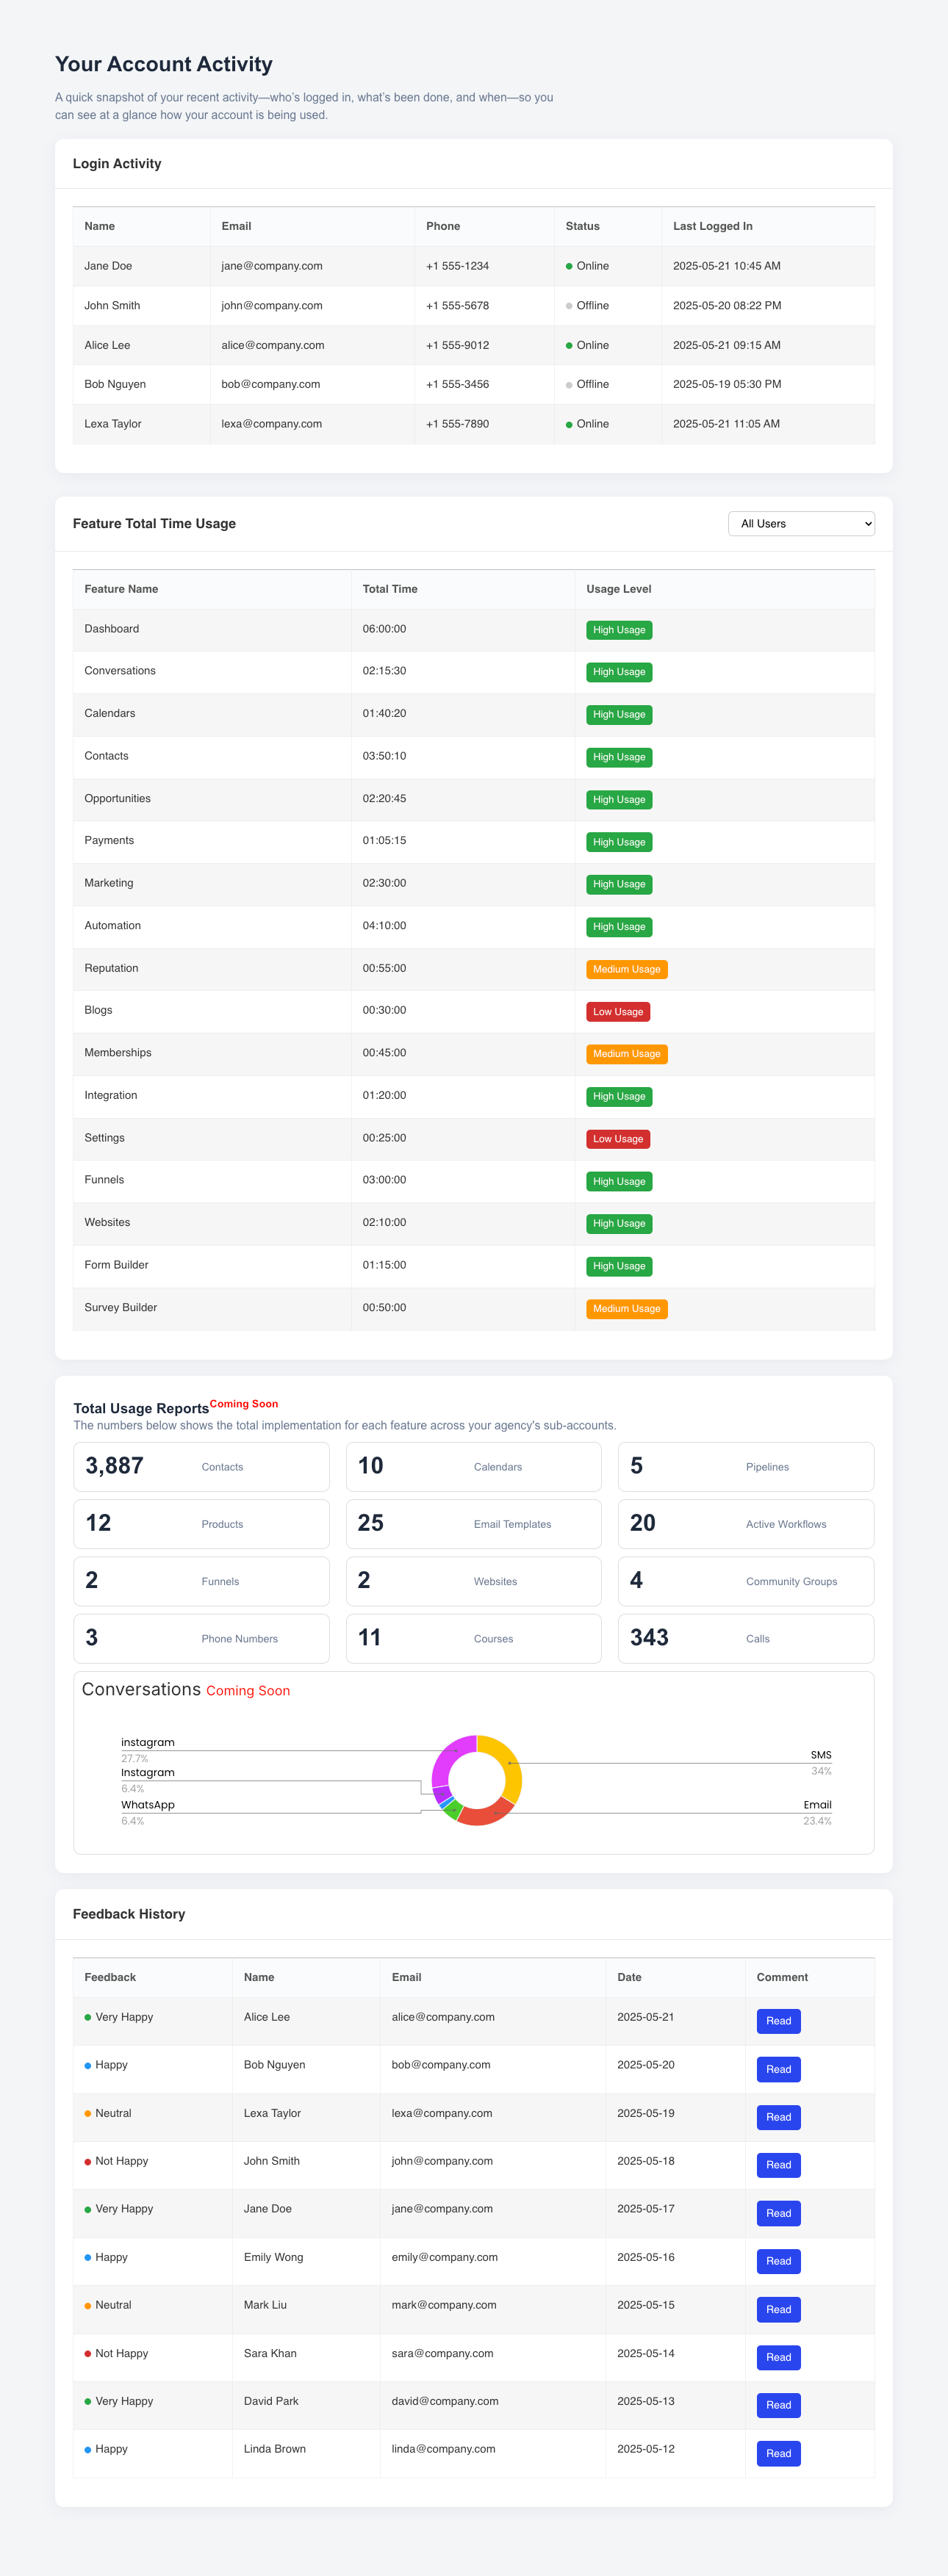
Your customers can now view:

  • Login Activity: See who logged in, when, and for how long

  • Feature Total Time Usage: Track how much time each user spent on every feature, with usage level indicators (High, Medium, Low)

  • Feedback History: See what users are saying with visual indicators for sentiment

  • Total Usage Summary (Coming Soon): Automatically generated metrics for contacts, calendars, funnels, websites, and more
🔧 How to Set Up:

  1. Copy your unique embed URL
    (e.g. https://activity.csmconnector.com/subaccount-activity/{{location.id}})

  2. Paste it into your Agency Settings → Custom Menu Links in HighLevel

  3. Label it "Account Activity" or anything you prefer
    ✔️ That’s it! Your customers will see the “Account Activity” tab directly in their side nav

This self-service experience improves transparency, reduces support tickets, and builds stronger trust with your clients—automatically branded as your own!
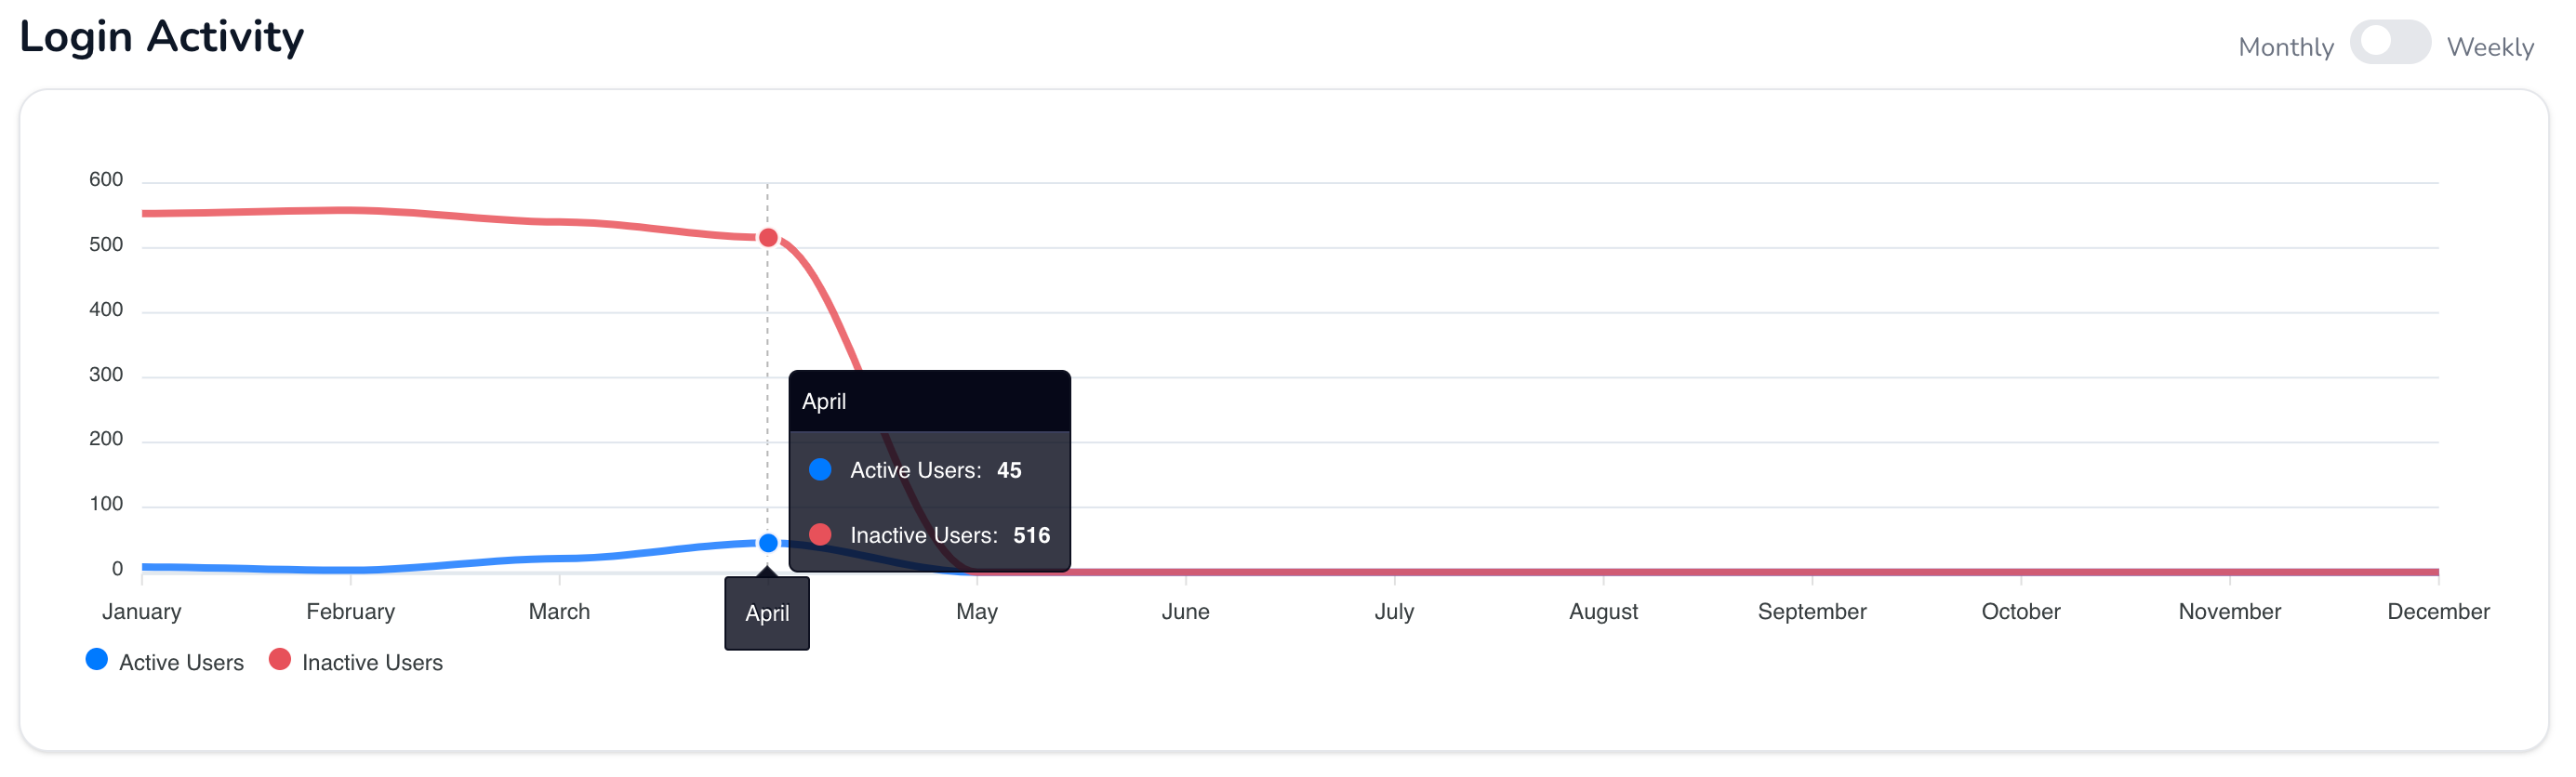
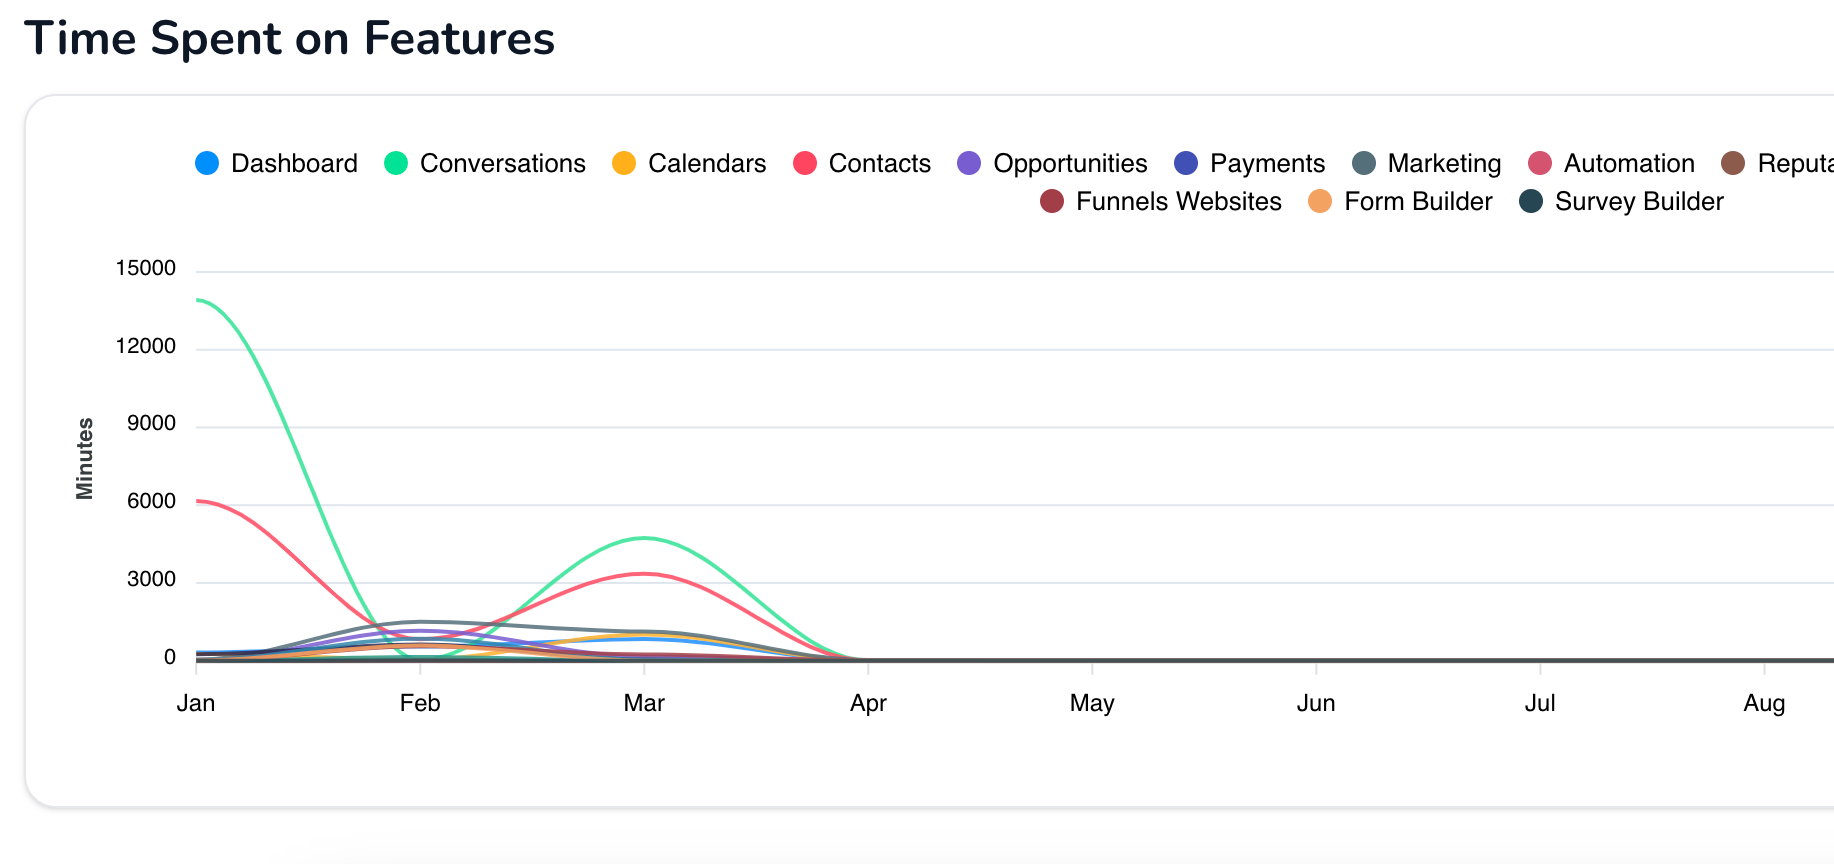
Login Activity & Time Spent on Features Trend Charts Now Live!

We’ve added two powerful new trend charts to your GoCSM Dashboard — giving you visual insights into user activity and feature engagement over time.

These dynamic charts help you monitor platform usage patterns and spot changes before they impact retention.

🆕 What’s New

📊 Login Activity Trend

Screenshot 2025-04-24 at 7
  • A clear line chart showing monthly or weekly login behavior.

  • Tracks Active vs. Inactive users over time, helping you spot drop-offs or spikes in platform engagement.

🕒 Time Spent on Features Trend

Screenshot 2025-04-24 at 7
  • Line chart showing how many minutes are spent per feature, over time.

  • View by Month or Week for detailed analysis.

  • You can include/exclude specific features to focus on what matters most to your strategy.

💡 Use Cases

🧠 Customer Health Monitoring:

Quickly identify engagement drops and re-engage accounts before churn happens.

📅 Seasonality & Behavior Trends:

Discover usage spikes tied to campaigns, updates, or time of year.

⚙️ Team or Feature Impact:

Correlate time spent with success initiatives or product updates.

These charts are now available in your GoCSM Dashboard.

Flip between Monthly or Weekly views and tailor the data to fit your analysis needs.

Need help using the filters or analyzing the trends? Join a support session or check the Help Docs.

📊 New Product Adoption by Companies & Users Charts Are Here!

We’ve just launched brand-new visual insights to help you track how your platform is being used — by both companies and users.

Introducing the New Product Adoption Charts — now available inside your GoCSM Dashboard!

🆕 What’s New

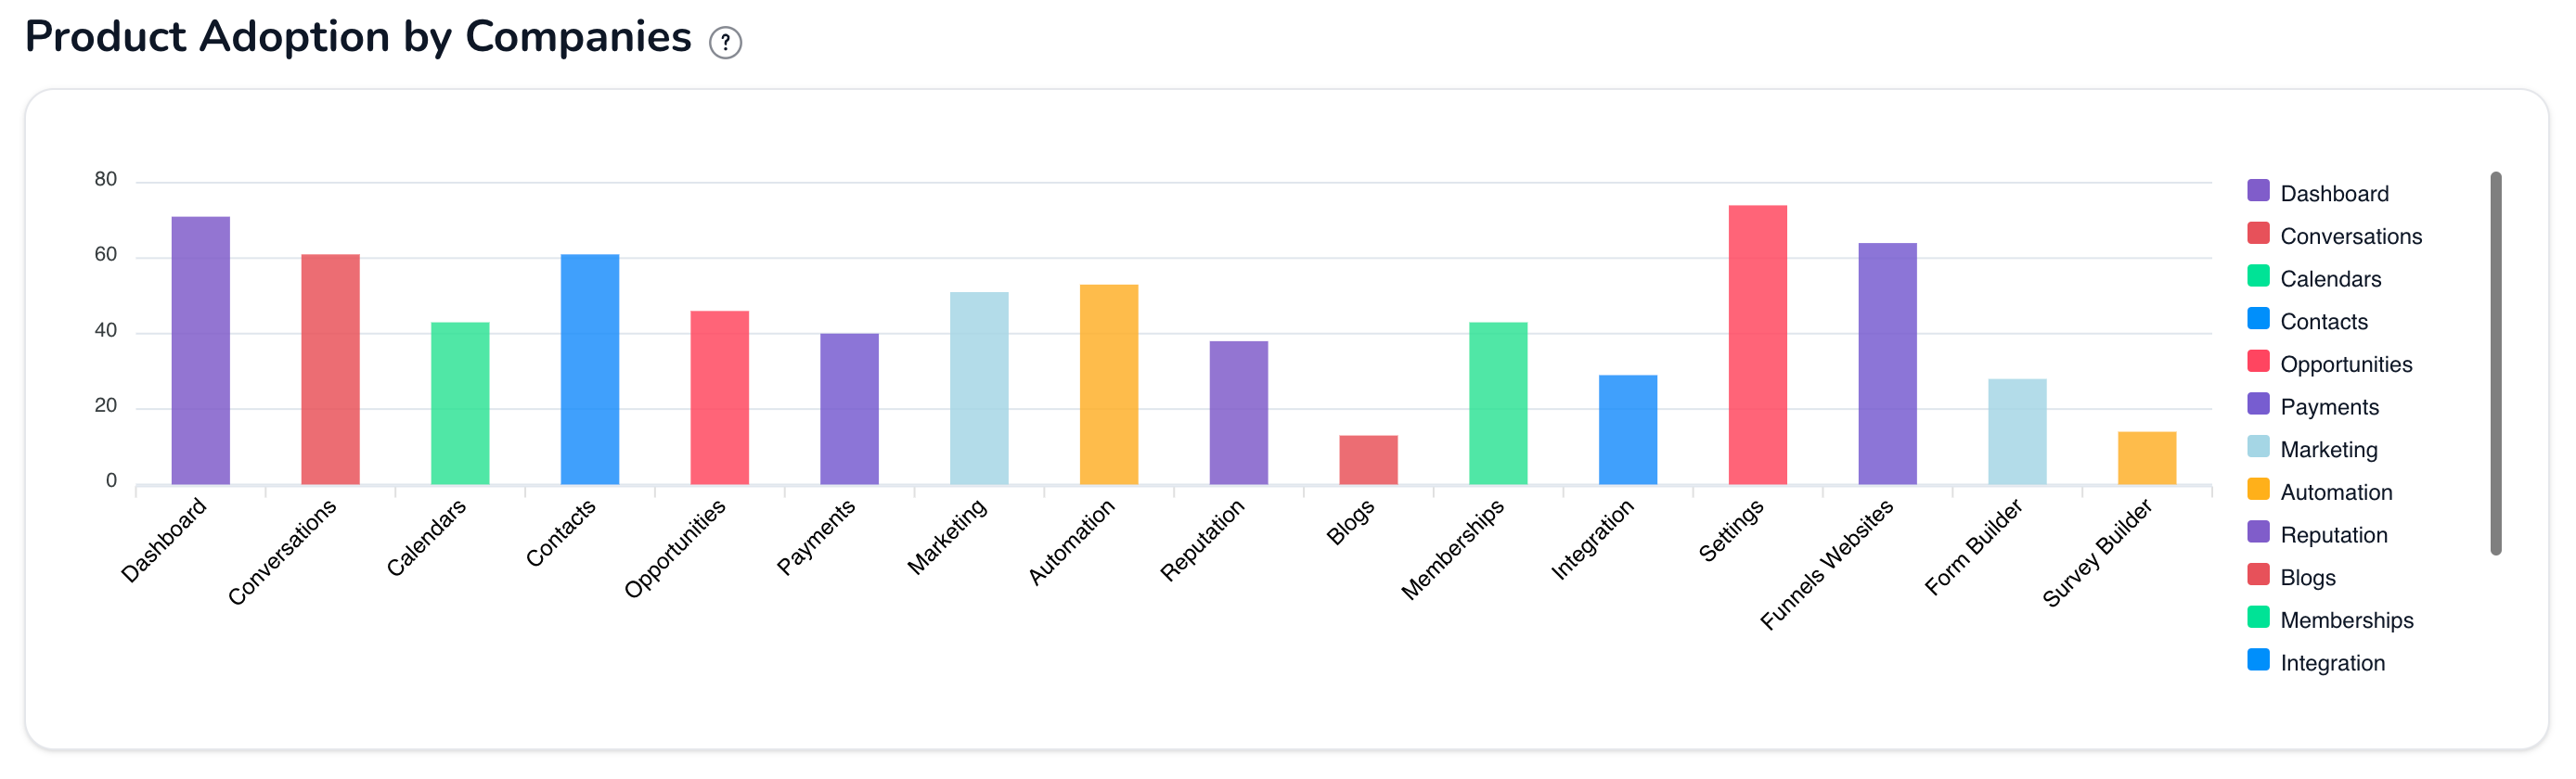
🔹 Product Adoption by Companies

Screenshot 2025-04-24 at 7
  • Displays the total number of companies actively using each feature.

  • Only includes companies that have spent at least 1 hour in the feature — giving you clean, meaningful data.

  • Click on any bar to instantly view a list of companies using that feature.

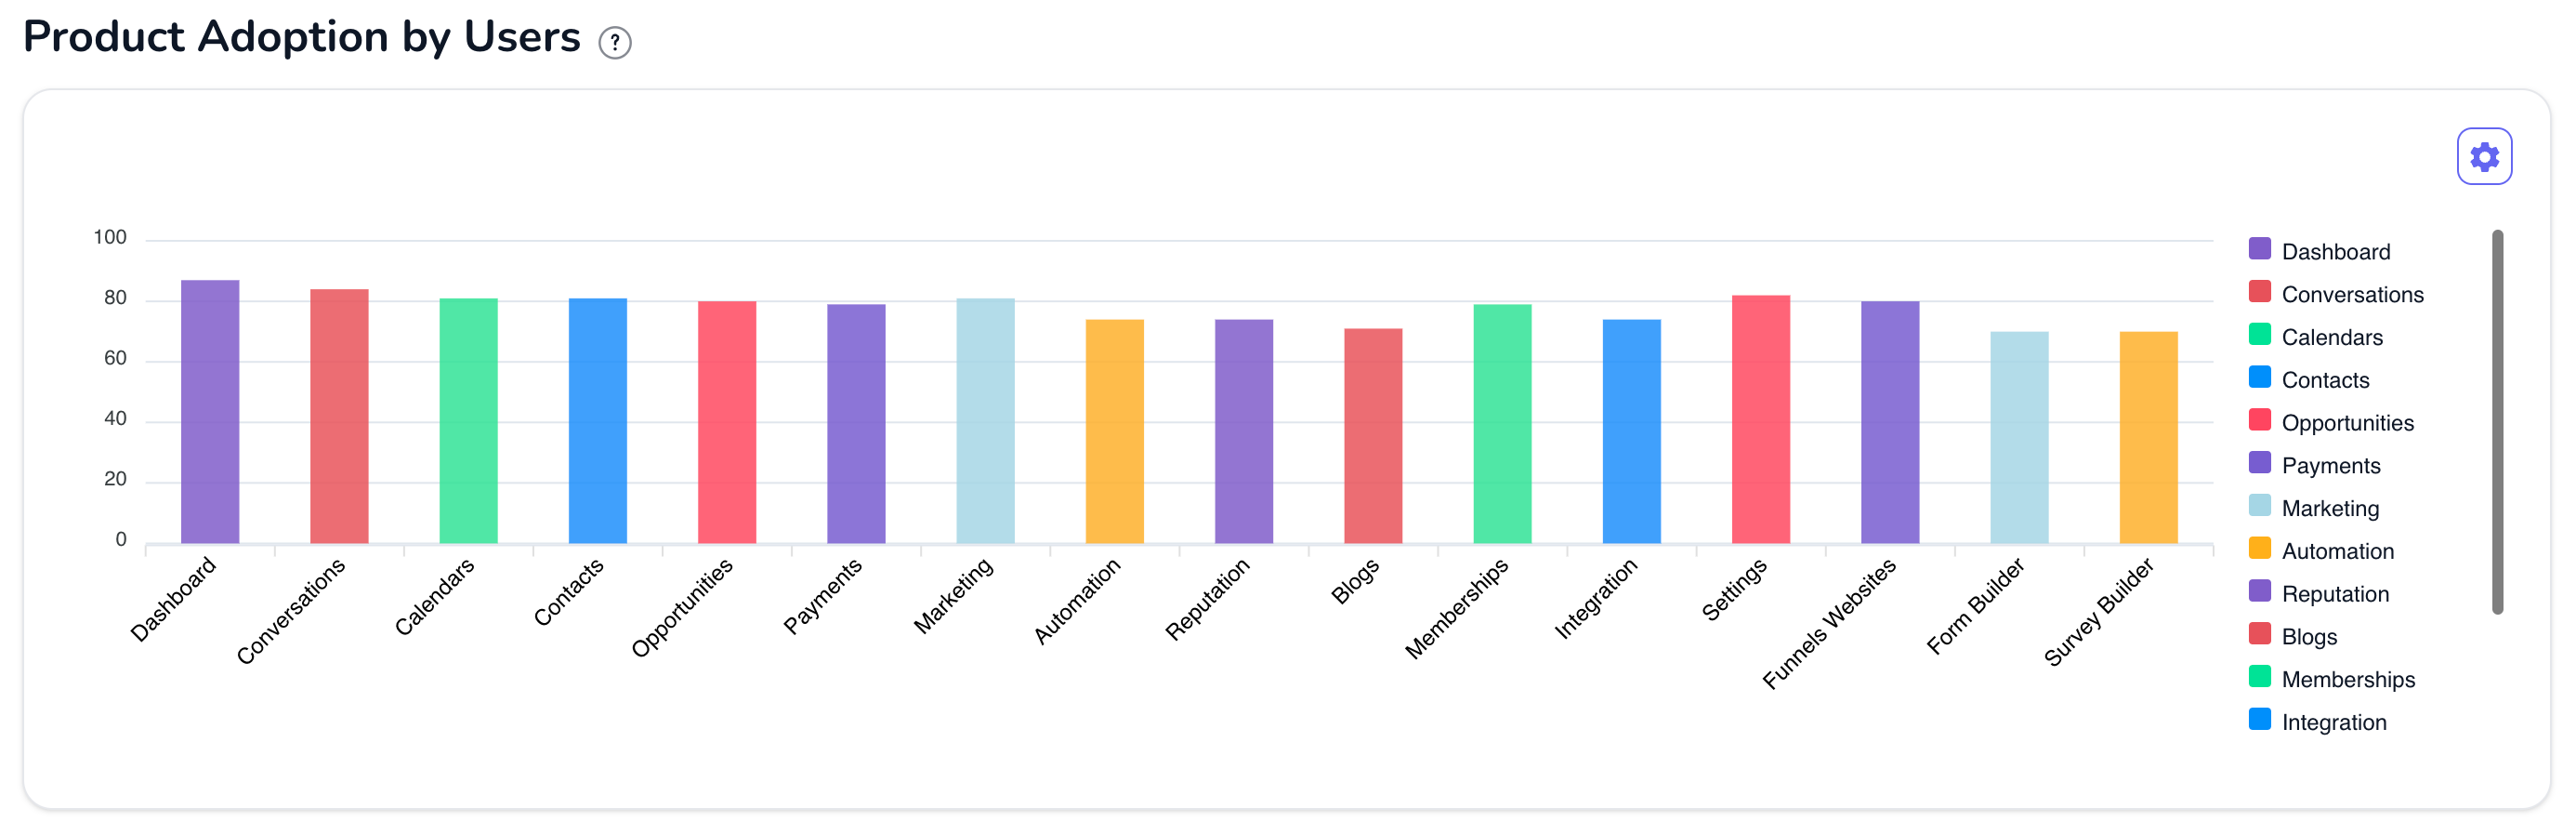
🔹 Product Adoption by Users

Screenshot 2025-04-24 at 7
  • Tracks how many individual users are engaging with each feature.

  • You can now link each bar to a Smart List — clicking the bar will redirect you to a filtered contact list based on feature usage.

  • Great for segmenting users by activity level!

💡 Use Cases

🎯 Spot High-Value Features:

See which features your users love — and which need more attention.

💬 Trigger Smart Campaigns:

Build automations or outreach workflows based on real usage data.

🧪 Test and Measure Adoption:

Launch new features, then monitor real-time user interaction.

This new chart section is now live for all GoCSM users.

Check it out in your dashboard and start turning data into action.

Need help? Join our support session or submit a ticket.

Earlier updates