July 6th, 2026
Feature update · Team Management
What This Update Is About
GoCSM can now track account ownership across your team. Team Connect lets you assign client sub-accounts to specific Customer Success Managers (CSMs), then filter any GoCSM dashboard down to just the accounts a given person owns.
Before this update, ownership was invisible to GoCSM. Every team member saw every sub-account, and knowing who was actually responsible for a given client lived in a spreadsheet, or in someone's memory. Now it lives in GoCSM.
This release answers three core questions for your team:
Ownership: Which team members are CSMs, and which sub-accounts does each of them own?
Coverage: How many accounts have an owner, and how many still need one?
Performance: How is each CSM's portfolio doing on health, revenue, and activity?
Key Features
Tag Team as CSMs: Designate any team member synced from GoHighLevel as a Customer Success Manager with one click, individually or in bulk, from the new Users tab.
Assign Sub-Accounts to CSMs: Connect each sub-account to a CSM from the new Assignments tab. Assignments save instantly and can be set, changed, or bulk-reassigned at any time.
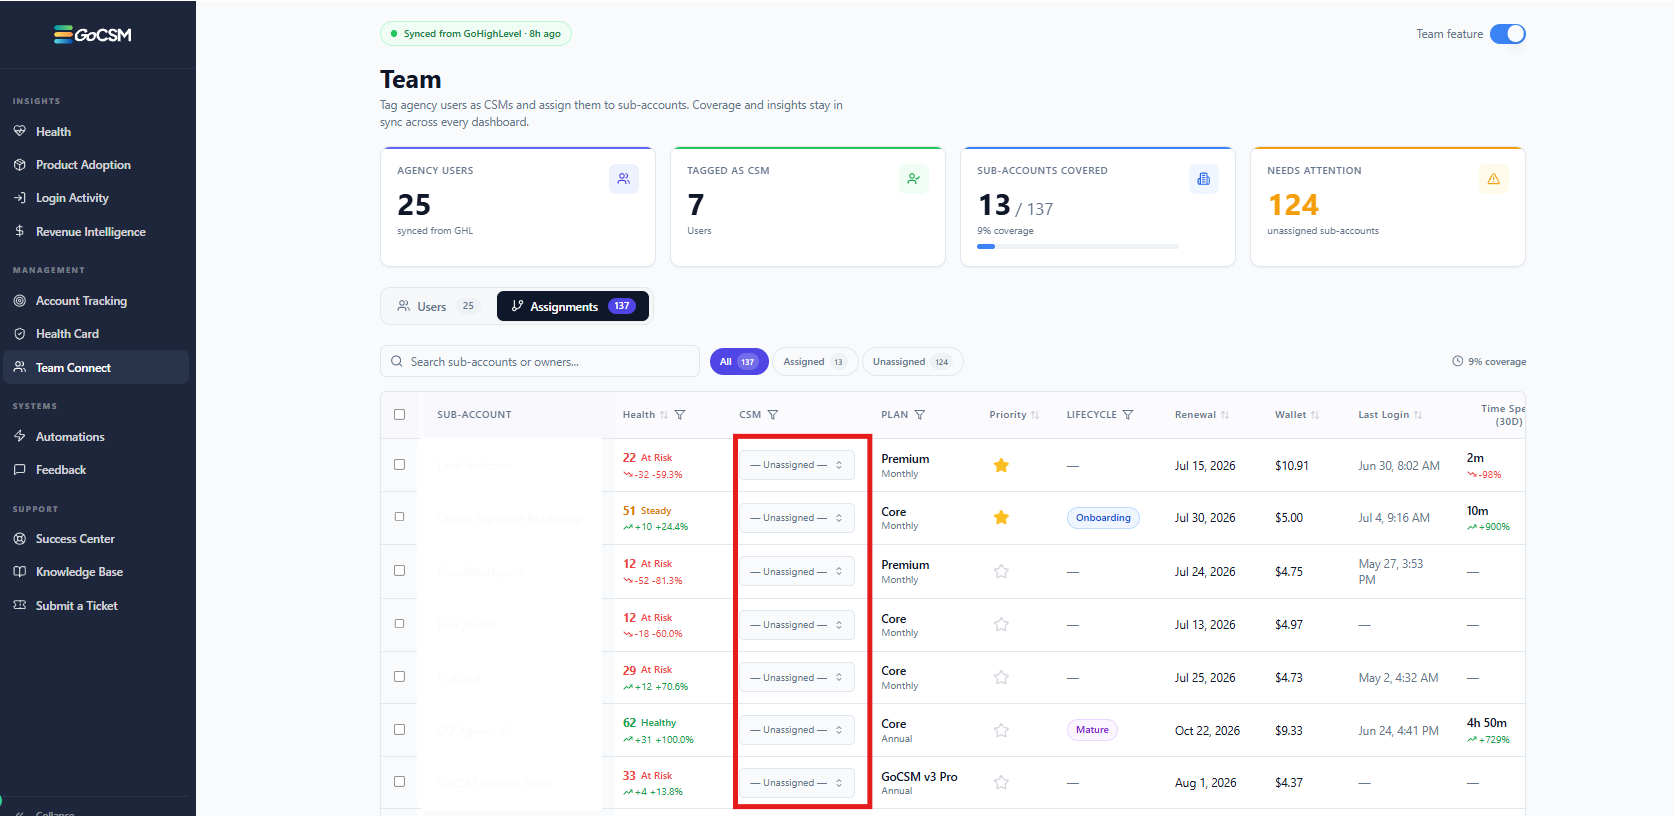
Workspace Coverage Stats: Four live cards track Agency Users, Tagged as CSM, Sub-Accounts Covered, and Needs Attention, updating automatically as you make changes.
CSM Filter on Four Dashboards: Filter Account Health, Revenue Intelligence, Login Activity, and Adoption down to one or more CSMs, scoping every score, trend, and figure to just their accounts.
More Accurate Accounts Requiring Attention: Account Health now only flags accounts with a genuinely low health score (70 or below), instead of always listing five accounts regardless of how healthy a portfolio is.
Why It Matters
As an agency grows past a handful of clients, dashboards stop being useful if everyone sees everything. A CSM managing 30 of 300 accounts shouldn't have to scroll past the other 270 to find what needs their attention, and a manager reviewing team performance shouldn't need a spreadsheet to know who owns what.
With this update, every person on your team gets a view scoped to what they're actually responsible for, coverage gaps are visible the moment they open GoCSM, and reassigning a departing CSM's accounts takes minutes instead of a manual audit.
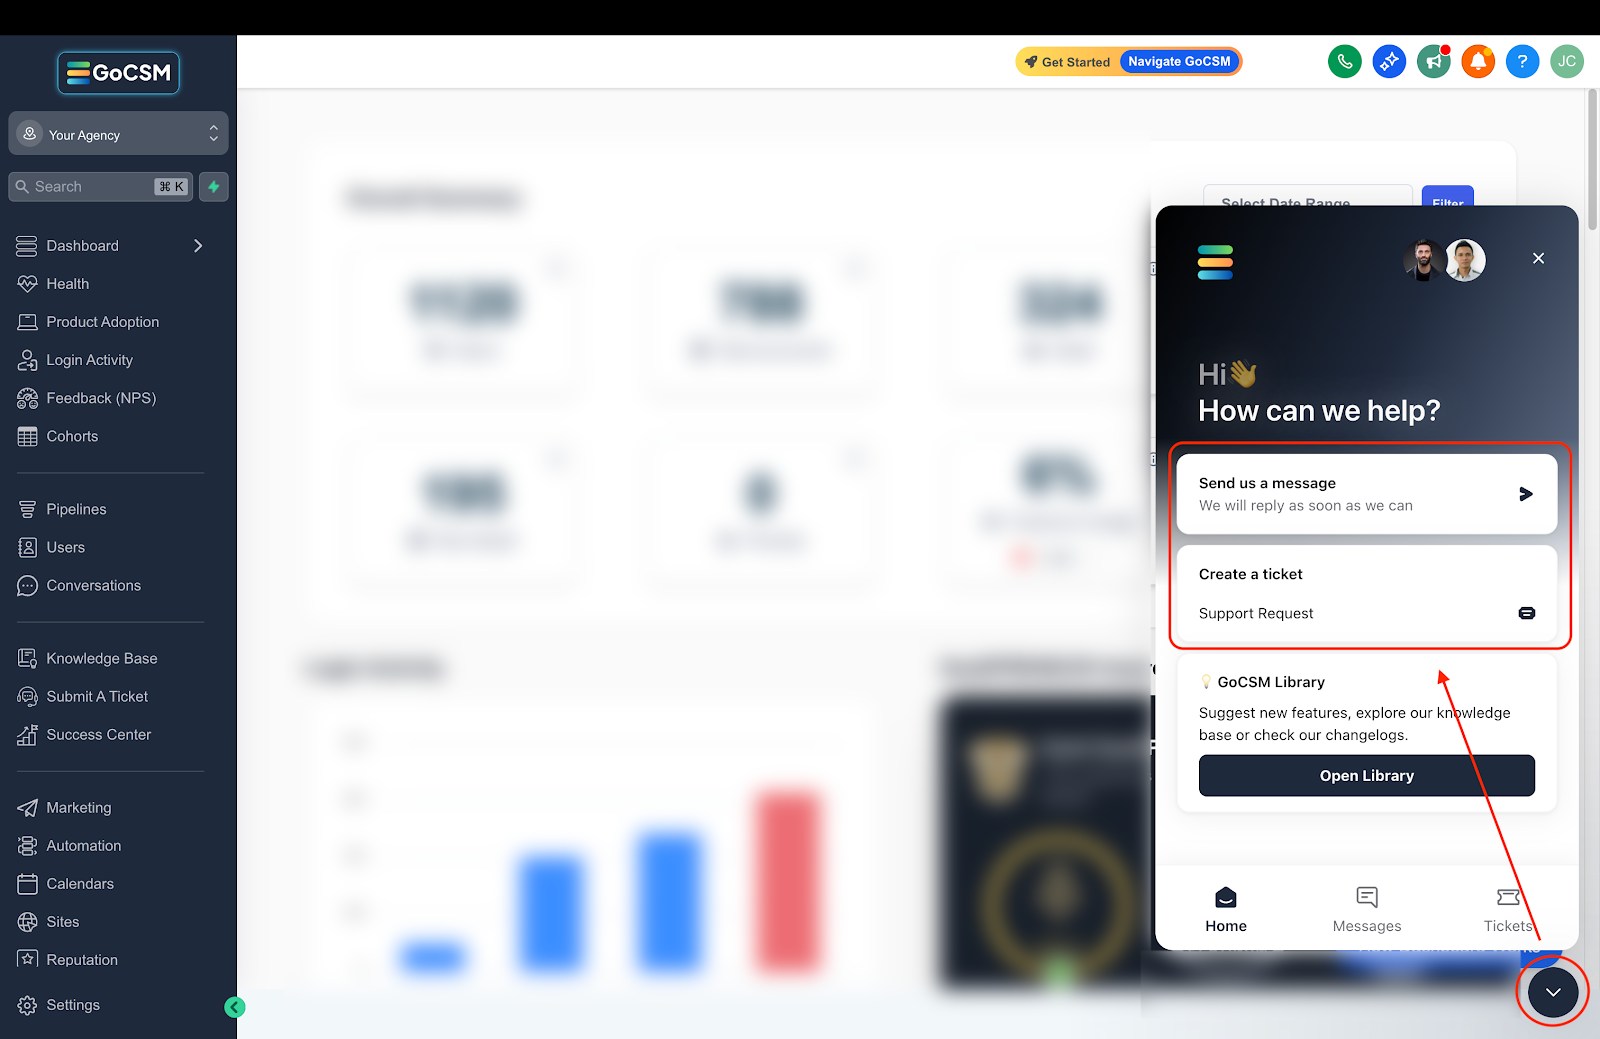
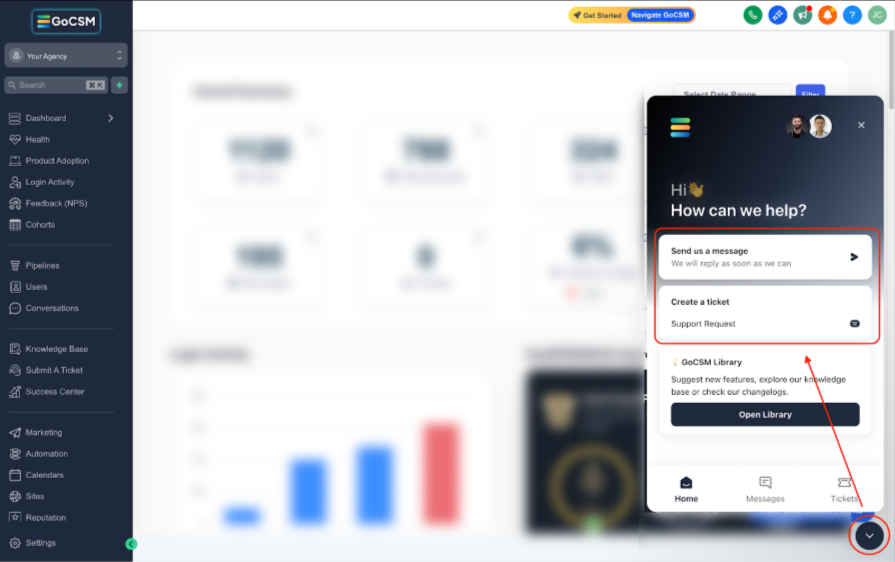
Have a feature request or spotted a bug? Let us know on our Ideas Board or submit a ticket through our Chat Widget. We're here to help!

June 17th, 2026
Feature update · Product Adoption
What This Update Is About
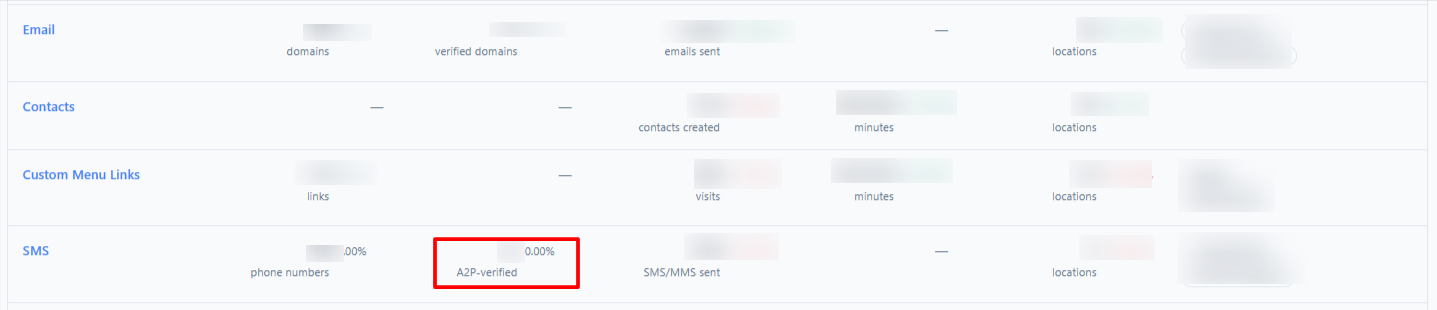
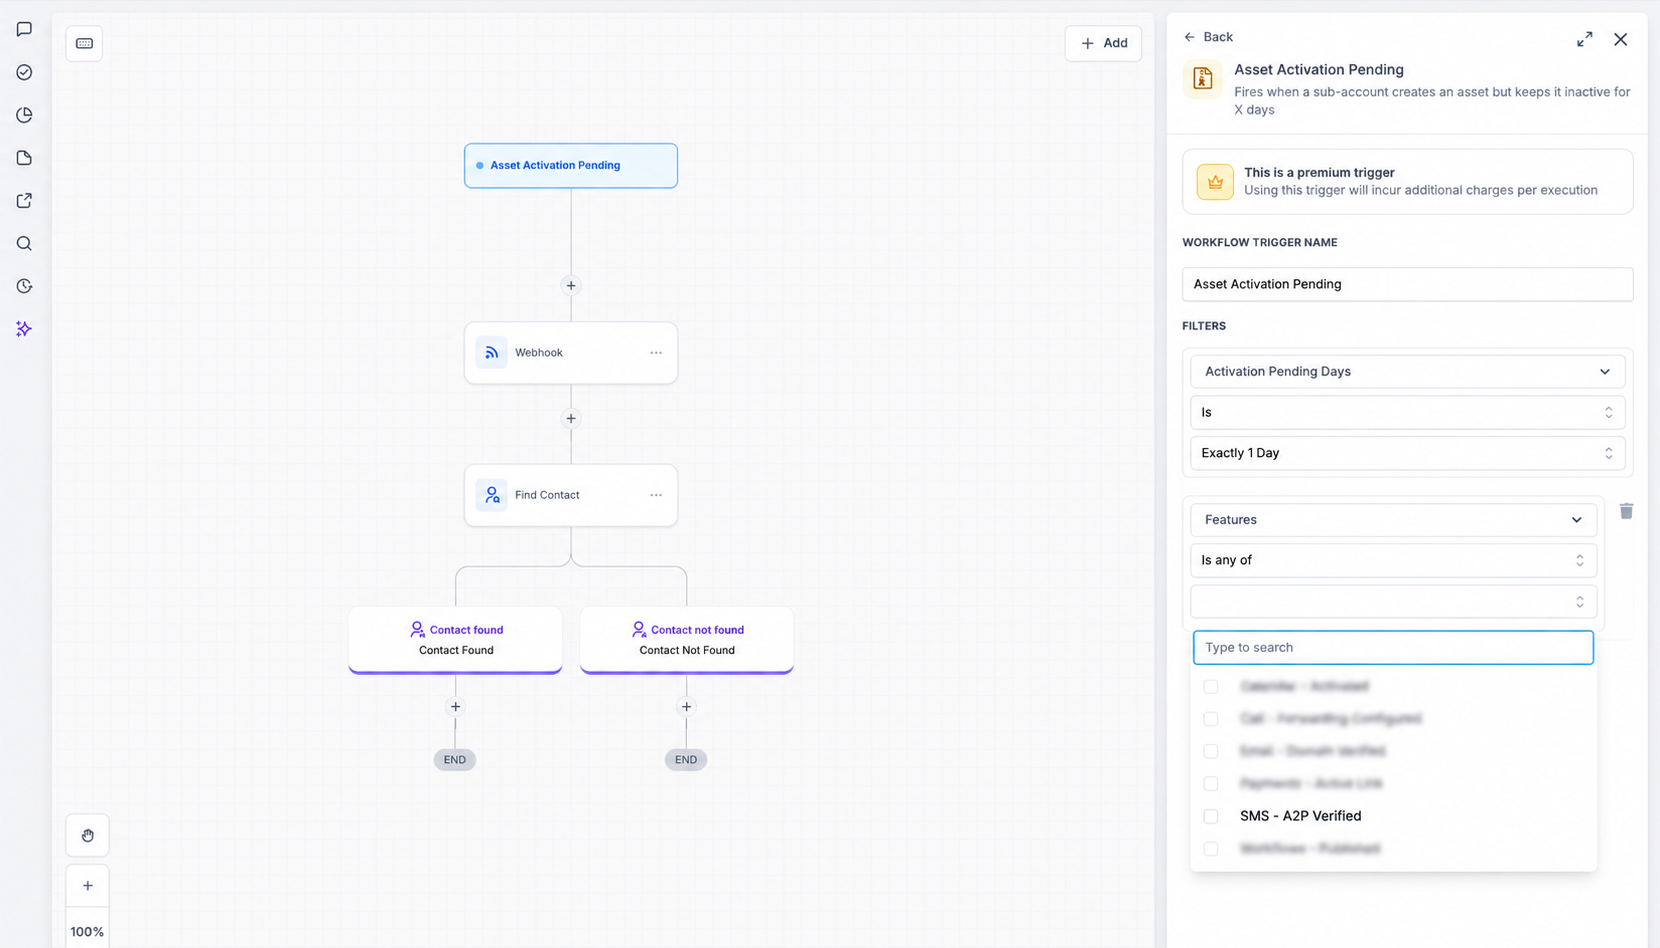
GoCSM now determines SMS activation based on whether a phone number is A2P verified. This gives you a far more accurate picture of which sub-accounts are truly ready to send SMS at scale.
Key Features
A2P-Based SMS Activation — A phone number now counts as activated only once it's A2P verified, giving you a compliance-aware signal of real SMS readiness check.
Updated "Asset Activation Pending" Trigger — The Asset Activation Pending workflow trigger now reflects the new criteria. SMS assets stay in a pending state until A2P verification completes, so any automation you've built fires against the correct, accurate definition of activation.
More Reliable Adoption Signal — By tying activation to A2P verification, GoCSM surfaces sub-accounts that aren't truly ready to message — before they run into deliverability issues or compliance blocks.
Why It Matters
SMS is one of the highest-impact channels GHL offers — but only if numbers are properly registered. An account that isn't A2P verified isn't actually capable of running real campaigns, and it is a genuine adoption gap.
Have a feature request or spotted a new bug? Let us know on our Ideas Board or submit a ticket through our Chat Widget — we're here to help!
June 11th, 2026
Feature update · Product Adoption
What This Update Is About
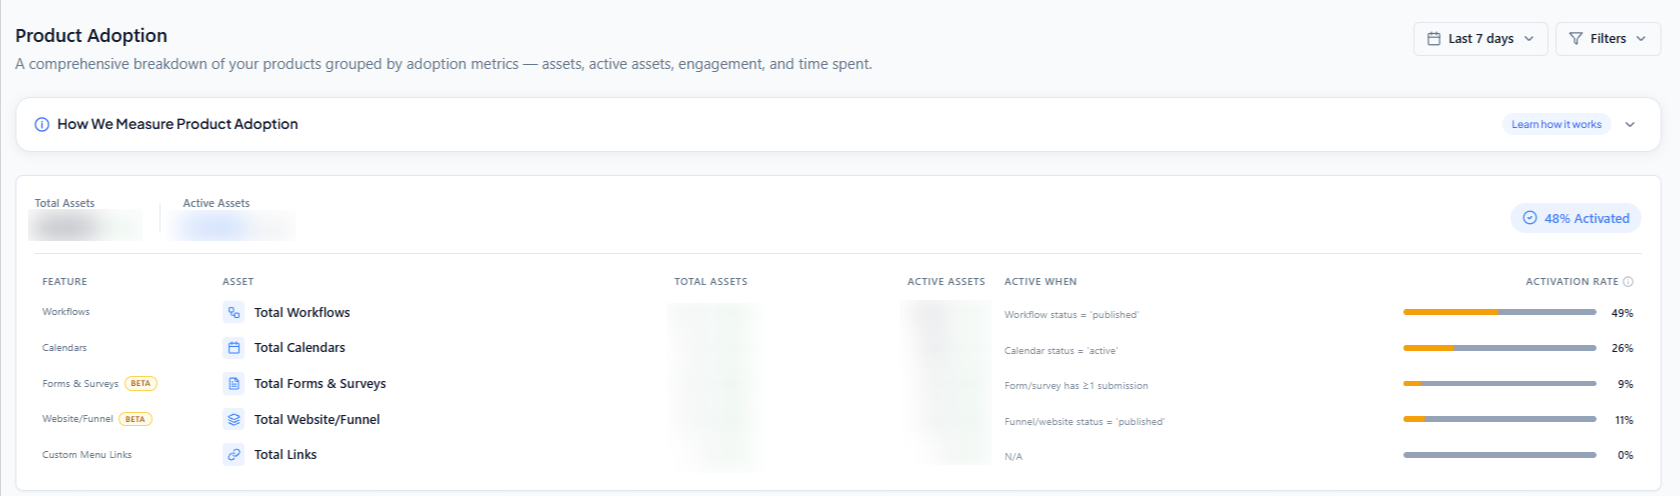
GoCSM can now track two of the most widely-used GHL features — Forms/Surveys and Websites/Funnels — giving you a clearer picture of whether your sub-accounts are actually using the tools they're paying for.
Before this update, adoption gaps in these two areas were invisible. An agency could have hundreds of sub-accounts with no active forms, zero funnel traffic, and no web presence — and GoCSM wouldn't flag it. Now it does.
The tracking answers two core questions for each sub-account:
Forms/Surveys: Has the sub-account built forms or surveys — and are they getting submissions?
Websites/Funnels: Has the sub-account published web assets — and are they receiving traffic?
Key Features
Forms & Survey Asset Tracking — GoCSM now detects whether a sub-account has forms or surveys built, so you can distinguish accounts that are genuinely set up from those that have never touched this feature.
Form & Survey Submission Counts — Beyond just checking if forms exist, GoCSM tracks submission volume — giving you a direct signal of whether sub-accounts are actively generating leads and capturing data.
Website & Funnel Asset Tracking — GoCSM now checks whether a sub-account has published websites or funnels — surfacing accounts with no web presence before they become a retention risk.
Website & Funnel Traffic Data — For accounts with active web assets, GoCSM tracks page view volume, so you can see whether those funnels are actually driving traffic or sitting dormant.
Health Score Integration — Both features now feed directly into the Product Adoption pillar of each sub-account's Health Score. If a sub-account has no active forms or no funnel traffic, that gap is reflected in their score — automatically.
Dedicated Tracking View — In addition to contributing to the Health Score, Forms/Surveys and Websites/Funnels data is also surfaced in a dedicated tracking section, so you can drill into the specifics without wading through the full health breakdown.
Why It Matters
Forms and funnels are where GHL delivers the most immediate, visible ROI for end clients. If a sub-account isn't using them, they're not seeing results — and accounts that don't see results churn.
With this update, you can proactively identify under-adopted accounts before frustration sets in, prioritize outreach toward accounts that haven't launched a single form or funnel, and confidently separate accounts that are genuinely active from those that are just technically onboarded.
Have a feature request or spotted a new bug? Let us know on our Ideas Board or submit a ticket through our Chat Widget — we're here to help!

June 2nd, 2026
This week covered a lot of ground — from deep data integrity fixes across Revenue, Health, and Contacts, to a significant expansion of the GoCSM AI/MCP connector toolset. We also shipped meaningful UX improvements to onboarding and trial activation. Here's everything fixed and improved:
❤️Health dashboard & sub-account health
Fixed A major CPU freeze on the Health page caused by an infinite re-render loop and runaway animation frame — the page now loads and scrolls smoothly.
Fixed Account trend data now shows real 7-day deltas instead of a false 0% across the board.
Fixed Login trend graph now correctly respects the selected time range on sub-account health views.
Fixed True period-over-period trends and window-scoped active user counts are now calculated correctly.
Fixed AI insights are now preserved when recompute is skipped, preventing hero-account insights from being wiped after trial activation.
Fixed The Last Updated tooltip now shows the real insight computation timestamp.
💰Revenue, churn & payments
Fixed Untracked churned accounts on the Revenue page now correctly display owner, churn date, and subscription duration.
Fixed Revenue Intelligence metrics and auth were stabilized; risk-tag auditing is now wired in correctly.
Fixed Dashboard demo ordering now correctly differentiates top spenders from low spenders.
Fixed Payment dashboard boundary spikes were eliminated by calculating order deltas per location and product.
📊Adoption, login activity & time spent
Fixed Login Activity Users tab now re-fetches on mount, so key-user toggles from other views always reflect correctly.
Fixed Custom date range trend dates and pagination totals in Login Activity are now accurate.
Fixed Deleted agency users are now excluded from active-user counts.
Fixed Time-spent totals now add up correctly — the artificial +2 min/login-day bonus has been removed so account totals equal the sum of features.
Fixed Sub-account adoption plan filter was broken and is now working again.
Fixed Calendar booking spikes resolved with per-location, per-calendar delta calculations.
Fixed Contact dashboard spikes fixed with per-account-aware delta logic.
MCP / Claude connector / GoCSM AI tools
Fixed Field mapping inconsistencies across get_account, search_accounts, and agency_overview have been reconciled.
Fixed Next renewal date and active users (30d) are now pulling from the correct data source.
Fixed Churned and cancelled accounts now surface correctly with honest scope reporting.
Fixed Lifecycle, engagement deltas, health/MRR enrichment, NRR, revenue deltas, failed-payment tags, and upcoming-renewal flags all corrected across multiple data phases.
Fixed Priority-account and plan filters are now applied correctly in list_inactive_users.
Fixed MRR renewing in 30 days now resolves correctly via the plans collection with self-healing sync.
Trigger engine & GHL automation
Fixed Adoption trigger payloads now pass GHL filter equality correctly, fixing silent trigger drops.
Fixed Assets-empty trigger now fires only when a section was never explored, using inventory semantics instead of outcome semantics.
Fixed We've fixed the issue where missing snapshots triggered false engagement spikes.
Fixed Conversations and Phone engagement labels are now aligned with updated label semantics.
Have a feature request or spotted a new bug? Let us know on our Ideas Board or submit a ticket through our Chat Widget — we're here to help!

June 1st, 2026
What This Update is About
We're excited to announce a new Product Adoption trigger — Feature Time Spent is Less Than X Since Sign-Up.
This trigger fires when a sub-account has spent less time than a configured threshold on one or more selected features, after being on the platform for a set number of days. Where the Feature Assets is Empty trigger catches accounts that never took a first step, this trigger catches accounts that started but stalled — they logged in, explored a little, and then went quiet.
Without this trigger, shallow engagement is invisible. You'd need to manually comb through usage data to spot the accounts stuck at 5 minutes on Workflows or 0 minutes on SMS — and by the time you do, the window to intervene has usually passed. This trigger converts that passive metric into an automated signal, firing at exactly the right moment with exactly the right context.
👉 Learn More About the Feature Time Spent is Less Than X Since Sign-Up Trigger
Key Features
Minute-Level Time Thresholds — Set any value from 1 to 99,999 minutes as your engagement floor. Whether you want to catch accounts under 10 minutes, under 30 minutes, or under 5 hours, the threshold is fully yours to define — no preset buckets.
Feature-Level Targeting — Select any combination of the 8 tracked features — Workflows, Calendars, Conversations, SMS, Phone Number, Email Domain, Custom Menu Link, and Products & Payments — so you're monitoring the features that matter most to your product model.
Single Bundled Payload — When multiple selected features fall below the threshold, one payload fires with everything bundled in.
{{feature.low_engagement_features}}lists every under-used feature by name.{{feature.low_engagement_count}}tells you exactly how many — so you can branch on severity without needing multiple workflow fires.Built-in Escalation Ladders — The Revisit filter lets you re-fire the trigger after 7, 15, 30, 60, or 90 days if engagement is still low. The revisit payload updates automatically — features that have improved drop off the list, so your second and third touches stay targeted. Set it to Never for a clean single-fire.
Priority and Plan Filtering — Optional filters for Sub-account Priority (High, Medium, Low) and SaaS Plan let you build tiered intervention workflows — routing high-priority accounts to a CSM call immediately while sending self-service nudges to lower-tier accounts.
Age-Gated Evaluation — The Days Since Sign-Up filter (3, 7, 14, 30, 60, or 90 days) ensures the trigger only evaluates accounts that have had a fair window to engage. New accounts are never flagged prematurely.
Why It Matters
Accounts that signed up, poked around, and then disengaged are harder to spot than accounts that never showed up at all — and they're just as likely to churn. This trigger gives you a structured, automated way to catch them at the right moment, before the pattern becomes permanent.
Use it to send targeted re-engagement content, flag accounts for CSM follow-up, or build escalation sequences that increase in intensity if the first touchpoint doesn't move the needle.
Need help with the new Trigger?

Reach out or submit a ticket through our Chat Widget — we're here to help!

May 26th, 2026
What This Update is About
We're excited to announce a new Product Adoption trigger — Feature Assets is Empty Since Sign-Up.
This trigger fires when a sub-account has created zero assets in one or more selected features after a configurable number of days since the account was provisioned. It's the earliest churn signal in the GoCSM trigger library, designed to catch accounts that have never taken a first step — no workflows built, no calendars created, no phone numbers added.
Without this trigger, a stalled onboarding is invisible until it's too late. You'd have to catch it manually from the Subaccounts dashboard — and by then, the client may already be gone. This trigger converts that passive metric into an automated intervention, firing at exactly the right moment with exactly the right context.
👉 Learn More About the Feature Assets is Empty Since Sign-Up Trigger
Key Features
Flexible Time Thresholds Configure the trigger to fire at 3, 7, 14, 30, 60, or 90 days since sign-up — so the intervention window matches your agency's onboarding SLA, not a one-size-fits-all default.
Feature-Level Targeting Select any combination of the 8 tracked features — Contacts, Workflows, Conversations, SMS, Email, Phone, Calendars, and Payment — so you can monitor the features that matter most to your product model and build messaging tailored to each gap.
Single Bundled Payload When multiple selected features are empty, one payload fires with all the context bundled in. {{feature.empty_features}} lists every empty feature by name.{{feature.empty_count}} tells you exactly how many — so you can branch on severity without needing multiple workflow fires.
Built-in Escalation Ladders The Revisit filter lets you re-fire the trigger after 7, 15, 30, 60, or 90 days if the account still hasn't created any assets — turning a one-shot alert into a persistent monitoring loop. Set it to Never for a clean single-fire.
Priority and Plan Filtering Optional filters for Sub-account Priority (High, Medium, Low) and SaaS Plan let you build tiered intervention workflows — routing high-priority accounts to a CSM immediately while sending self-service nudges to lower-tier accounts.
Contactless Execution This trigger runs at the account level and does not require a GHL contact record to execute. No Find Contact step needed.
Why It Matters
Accounts that never create a single asset are your highest churn-risk cohort — and right now, most agencies only discover them reactively. This trigger gives you a structured, automated way to intervene at the exact moment an account crosses your defined threshold, before disengagement sets in.
Use it to send early onboarding nudges, flag accounts for CSM follow-up, or build escalation sequences that increase in intensity if the first touchpoint doesn't move the needle.
Need help with the new Health Dashboard?

Reach out or submit a ticket through our Chat Widget — we're here to help!

May 13th, 2026
This week, we've added new filtering capabilities, optimized our interface animations for a snappier experience, and deployed heavy-duty monitoring tools so our team can support you faster than ever.
🚀 What's New & Improved
Added: Introduced a "Select All" function in the Sub-Account table to streamline bulk actions and save you time.
Added: Rolled out new "No-SaaS" filters within the Product Adoption and Revenue Intelligence tabs for more granular reporting.
Improved: Standardized terminology across the app, replacing confusing "Manual" labels with clear "No-SaaS" tags.
Improved: Optimized interface animations using a session-based approach, eliminating jarring page reloads when switching between tabs.
Improved: Enhanced overall text readability and layout spacing within the Success tab.
Improved: Standardized all "Last updated" timestamp labels across the entire application for visual consistency.
Have a feature request or an idea to improve the platform? Let us know on our Ideas Board or drop a comment below!
May 13th, 2026
This week, our primary focus was on establishing absolute data integrity across the platform. We squashed several underlying bugs causing metric mismatches, stabilized our nightly AI insights engine, and smoothed out date filtering and tab navigation for a tighter overall experience.
Here is everything we fixed and improved this week:
❤️ Health Scores & Core Data
Fixed: Addressed a series of underlying calculation bugs affecting dashboard metrics, ensuring that health scores, revenue categories, and growth totals now reflect 100% accurate data.
Fixed: Corrected Total Revenue mismatches between the Health Overview, the Sub-Account tab, and Revenue Intelligence.
Fixed: Corrected an issue causing Calendar Asset counts to mismatch.
Fixed: Restored reliability to our nightly AI recommendation engine, resolving an issue that caused it to generate confusing text. Users will now wake up to clear, sensible insights every morning.
Fixed: Smoothed out backend data synchronization processes.
💰 Revenue Intelligence
Fixed: Fixed a tracking error where accounts were displaying a "No Plan" status despite having an active Core Plan in GHL.
Fixed: Addressed a filtering bug in Revenue Intelligence to ensure add-ons display the correct details.
Fixed: Resolved an issue where Non-SaaS accounts incorrectly displayed an "Unknown" plan name within the Revenue tab.
📊 Analytics, Filters & Navigation
Fixed: Corrected a navigation bug in Login Activity where single-account users were incorrectly seeing all users in the account view.
Fixed: Addressed a bug in the Login Activity date filter, allowing users to seamlessly switch back to a 30-day view after selecting the 7 or 15-day options.
Fixed: Resolved an interaction issue with the Custom Date picker, ensuring the calendar opens reliably upon repeated clicks.
Fixed: Fixed a bug that prevented the Product Adoption date filter from applying correctly.
Have a feature request or spotted a new bug? Let us know on our Ideas Board or submit a ticket through our Chat Widget — we're here to help!

May 12th, 2026
What This Update is About
We are thrilled to announce the launch of the GoCSM Health Dashboard! This powerful new feature gives you a complete, real-time picture of how every sub-account in your agency is performing — so you can stop reacting to churn and start getting ahead of it.
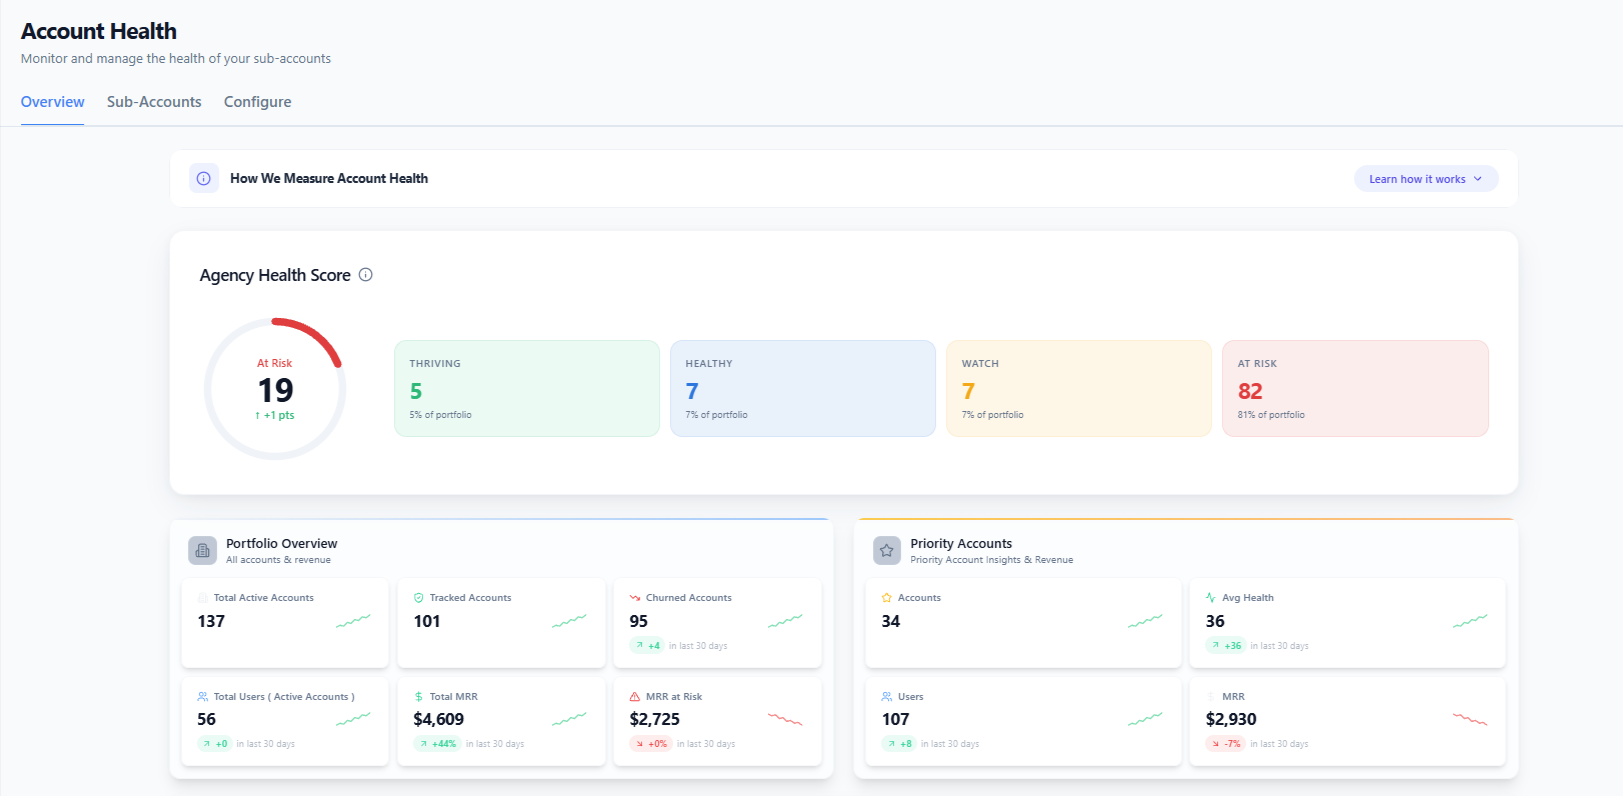
Instead of manually checking multiple data points across accounts, the Health Dashboard brings everything into one unified view and answers four core questions:
Product Adoption: Are your clients actually set up and using the platform? (Feature activation & usage)
Revenue Intelligence: Is the account financially healthy? (Billing trends, payment reliability, plan changes)
Login Activity: Are the right people showing up? (Owner and key user engagement)
Customer Sentiment: How do clients feel about your service? (Ratings and feedback from the past 30 days)
👉 Learn More About What is Health
👉 Learn More About Health Overview
👉 Learn More About Sub-Accounts
👉 Learn More About Configuring Account Health
Key Features
Account Health Score (0–100) Every sub-account receives a single composite score calculated from the four pillars above — giving you an instant read on account performance without digging through raw data.
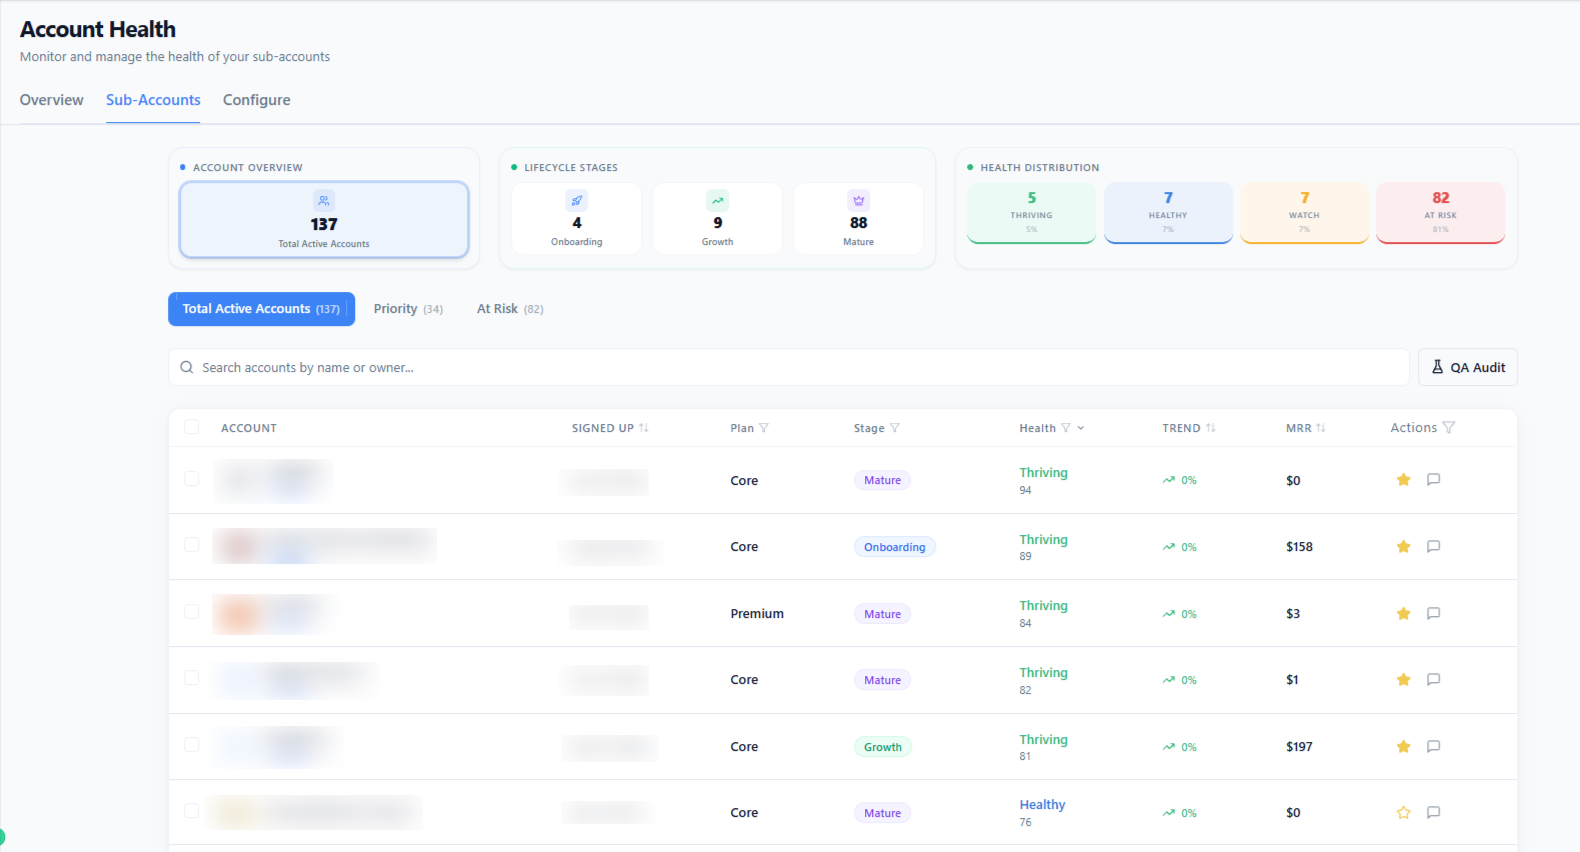
Four Health Bands Accounts are automatically grouped into Thriving (80–100), Healthy (60–79), Steady (40–59), and At Risk (0–39) — so you always know where to focus first.
Health Overview Dashboard A single agency-wide command center showing your overall health score, health band distribution, total MRR, MRR at risk, accounts requiring immediate attention, and a historical health trend graph.
Sub-Accounts Page A detailed account table showing each sub-account's health score, band, trend direction, lifecycle stage, and MRR — with tabs to filter by all accounts, priority accounts, or At Risk accounts.
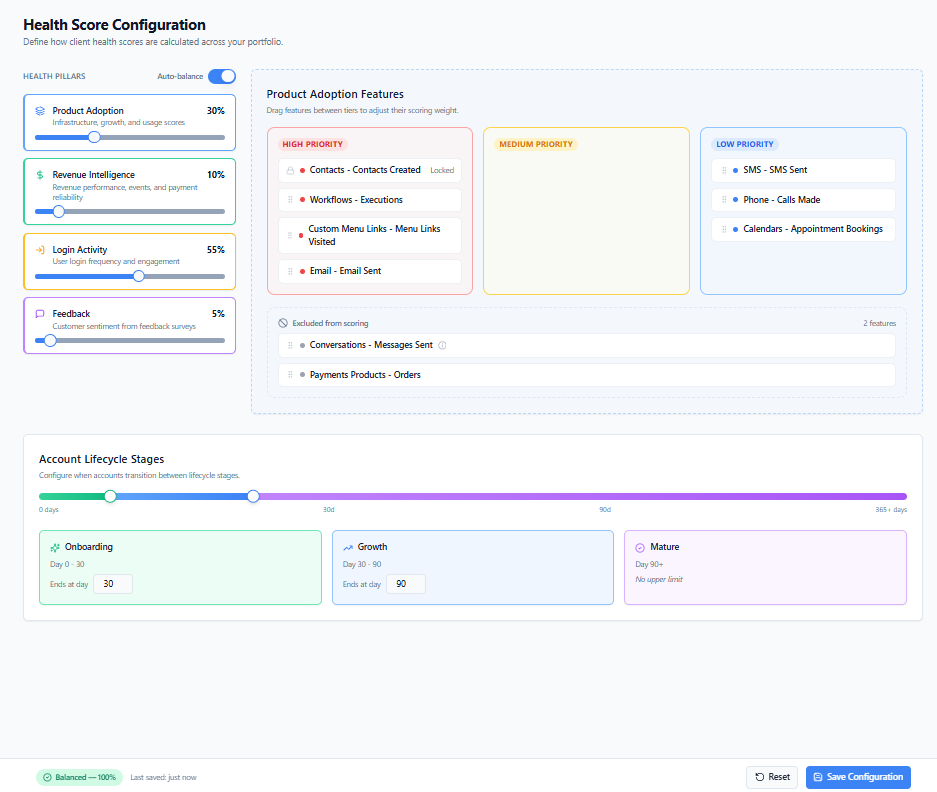
Fully Configurable Health Scoring Make the Health Score reflect your agency's unique definition of success — not a one-size-fits-all formula. From the Configure tab you can adjust pillar weights (all four must total 100%), choose which of the 9 trackable features are required for your clients, set feature priority levels (High, Medium, or Low) to control their impact on Usage scoring, and customize the lifecycle stage boundaries that determine when accounts transition from Onboarding to Growth to Mature.
Daily Score Updates Health Scores recalculate every night at 3:00 AM. Manual recalculation is also available at any time directly from the account detail view.
Smart Score Mechanics Scores are designed to be stable and meaningful — movement is capped at ±25 points per month to prevent sudden swings, and accounts with structural issues are capped at a maximum score of 35 until the root cause is addressed.
Why it Matters
Churn rarely happens overnight — it builds quietly through low adoption, missed payments, and disengaged users. The Health Dashboard gives your team an early warning system so you can intervene before issues escalate, focus your energy on the accounts that need it most, and confidently identify which Thriving accounts are ready for upsells, testimonials, or expansion conversations.
Need help with the new Health Dashboard?

Reach out or submit a ticket through our Chat Widget — we're here to help!

March 26th, 2026
What This Update is About
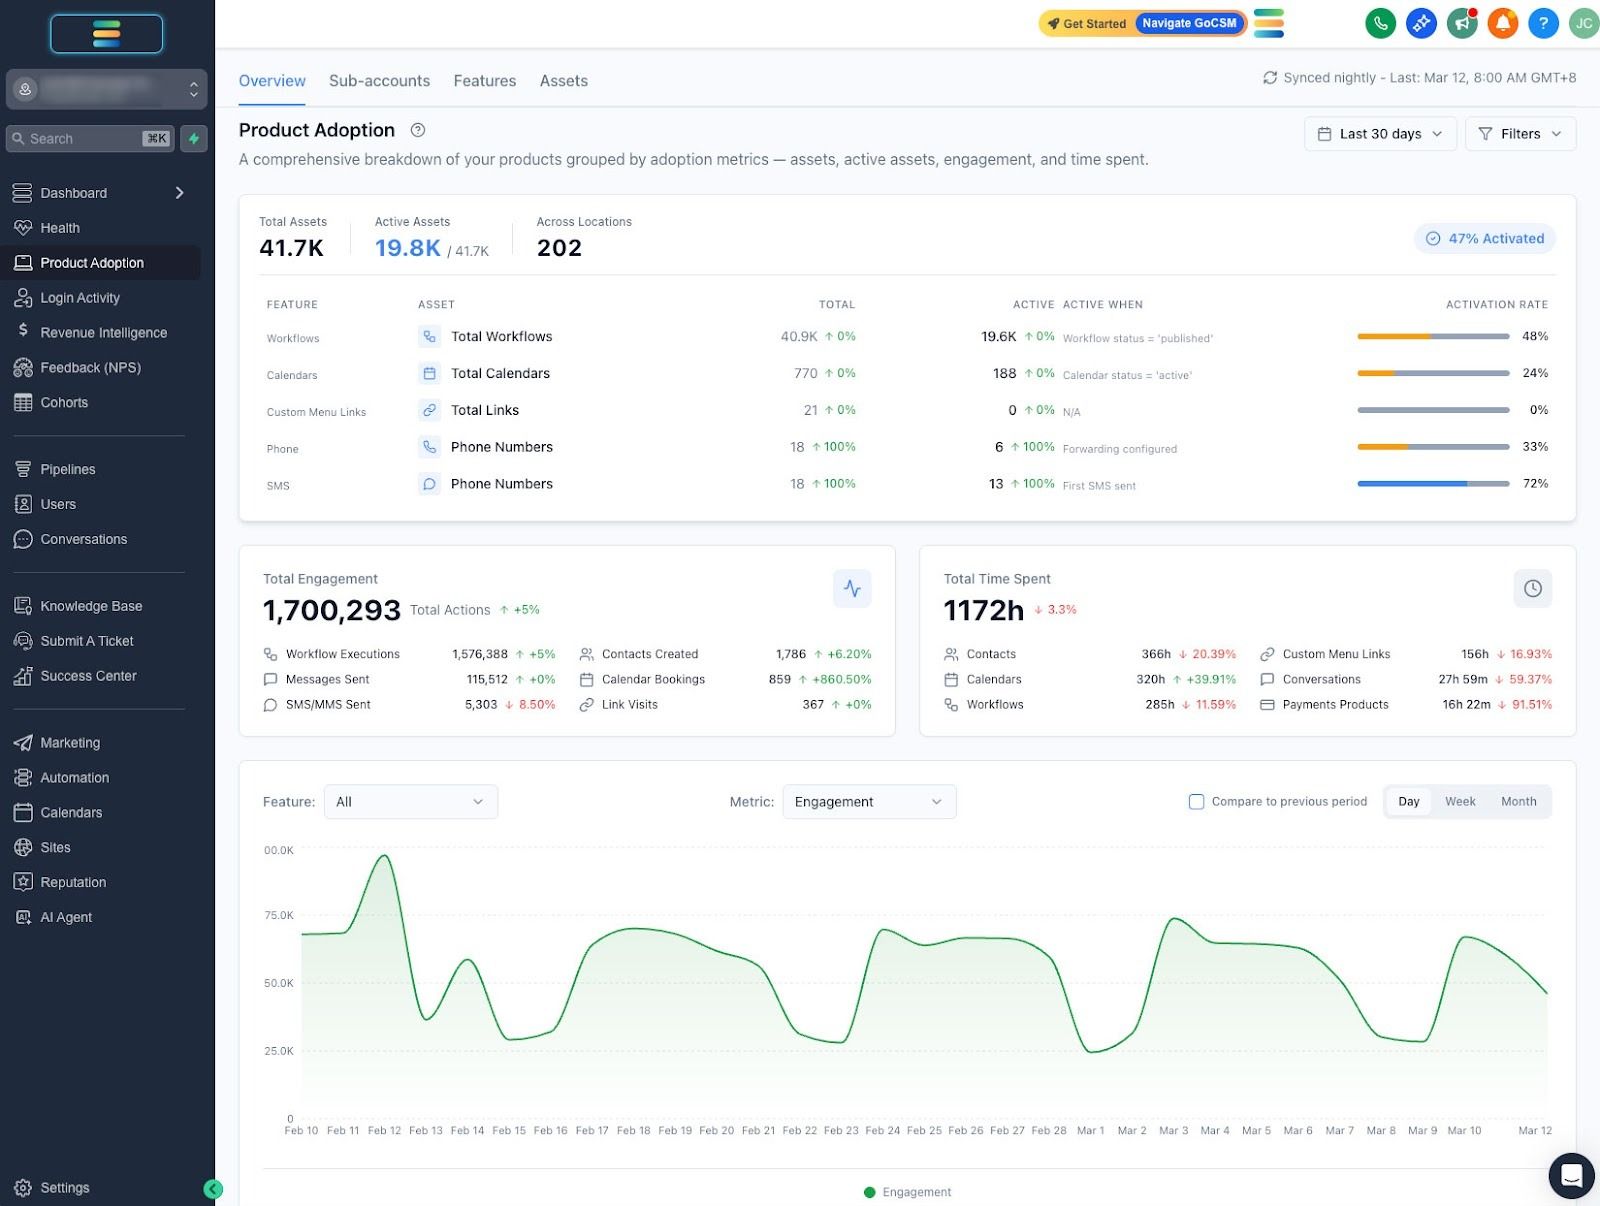
We are thrilled to announce the launch of the Product Adoption Dashboard! This powerful new reporting suite monitors exactly how deeply your SaaS customers are using the features available in their accounts.
Instead of guessing if your customers are finding value, this dashboard answers four core questions:
Assets: What have they created or acquired? (Potential value)
Active Assets: How many are properly set up? (Ready for use)
Engagement: How much actual usage is happening? (Actions & outputs)
Time Spent: How much time are they investing? (Focus depth)
👉 Learn More About Product Adoption Overview
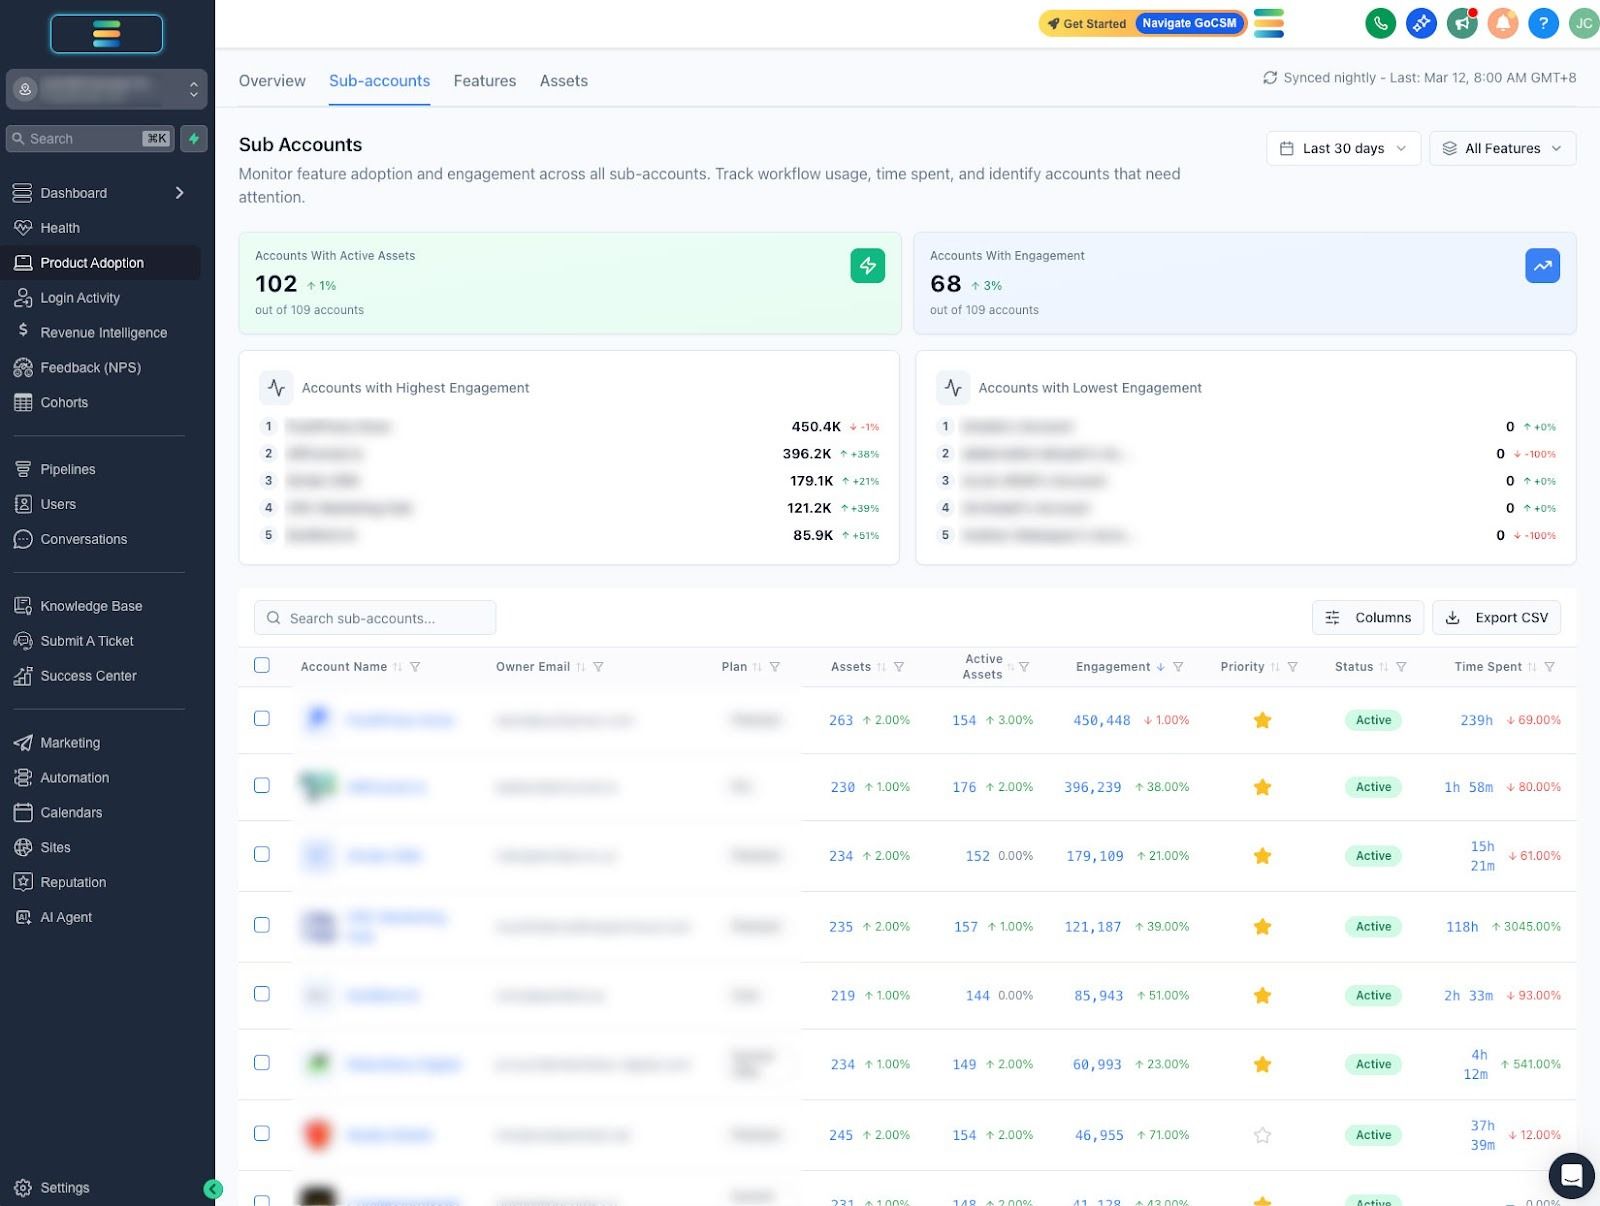
👉 Learn More About Product Adoption Sub-Accounts
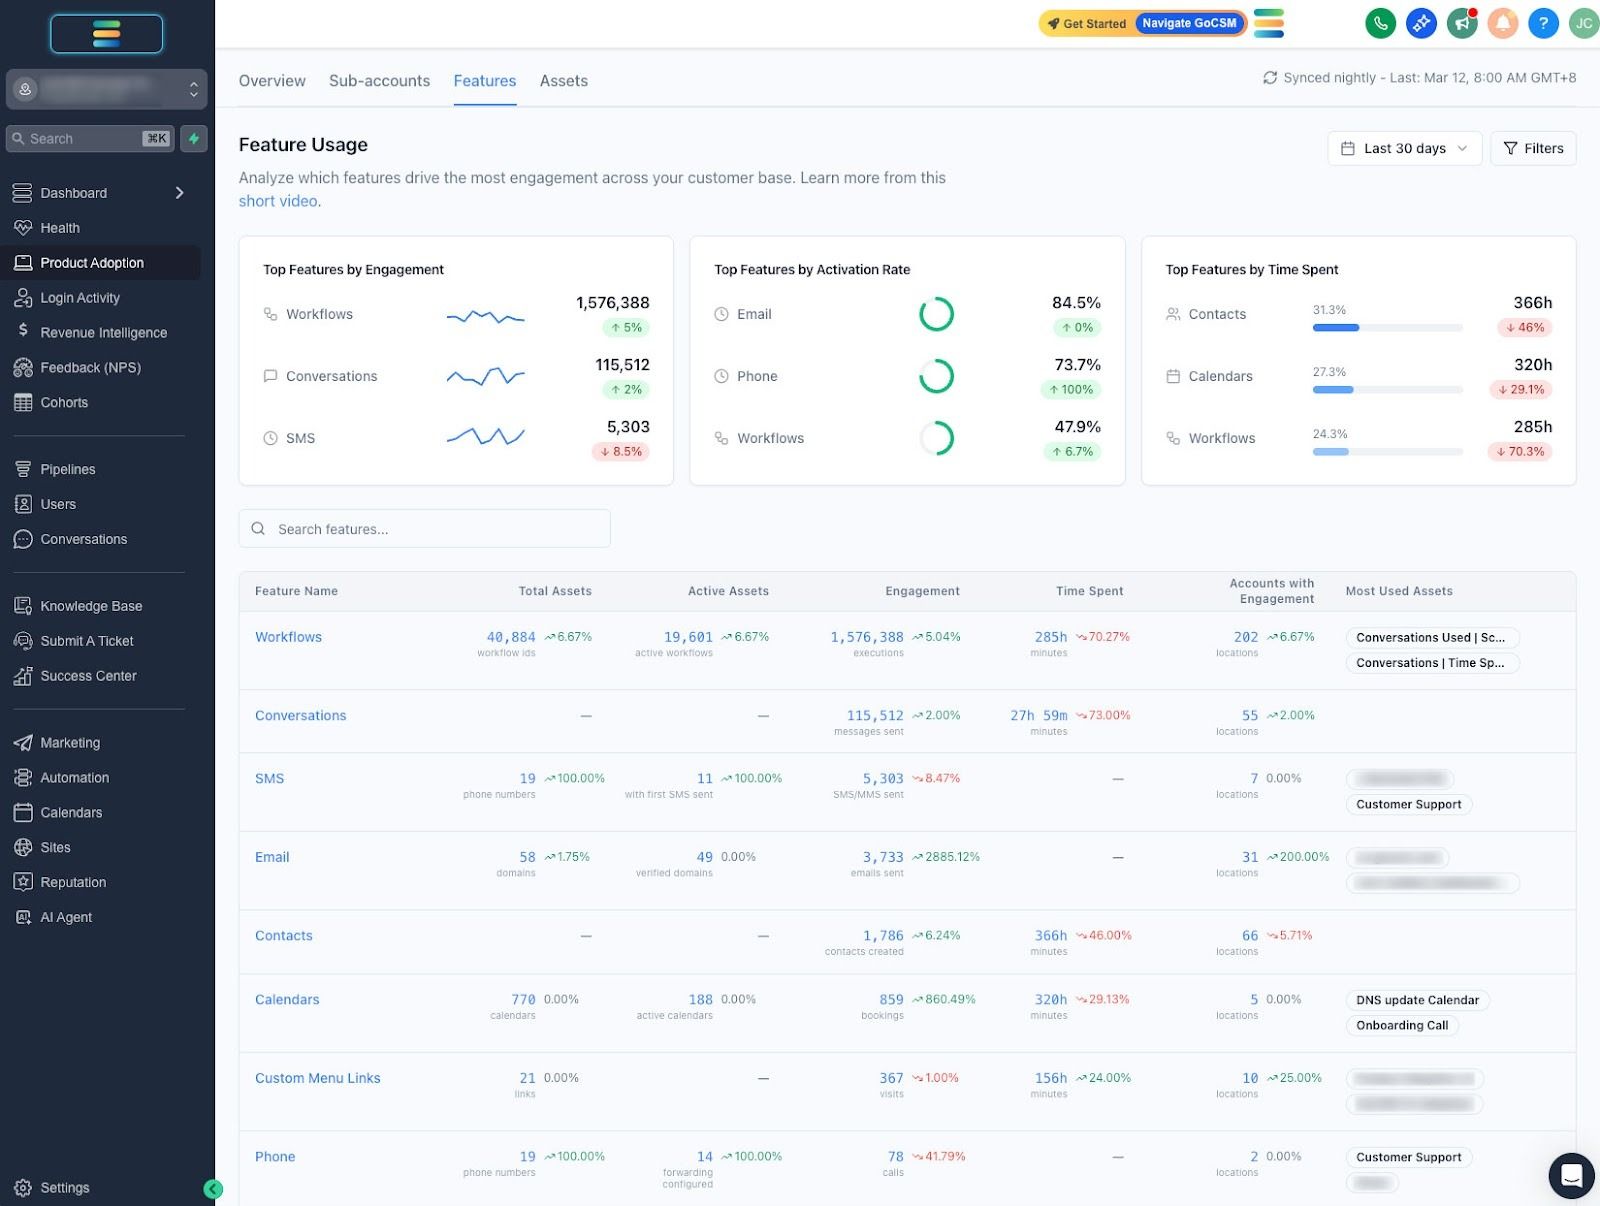
👉 Learn More About Product Adoption Features
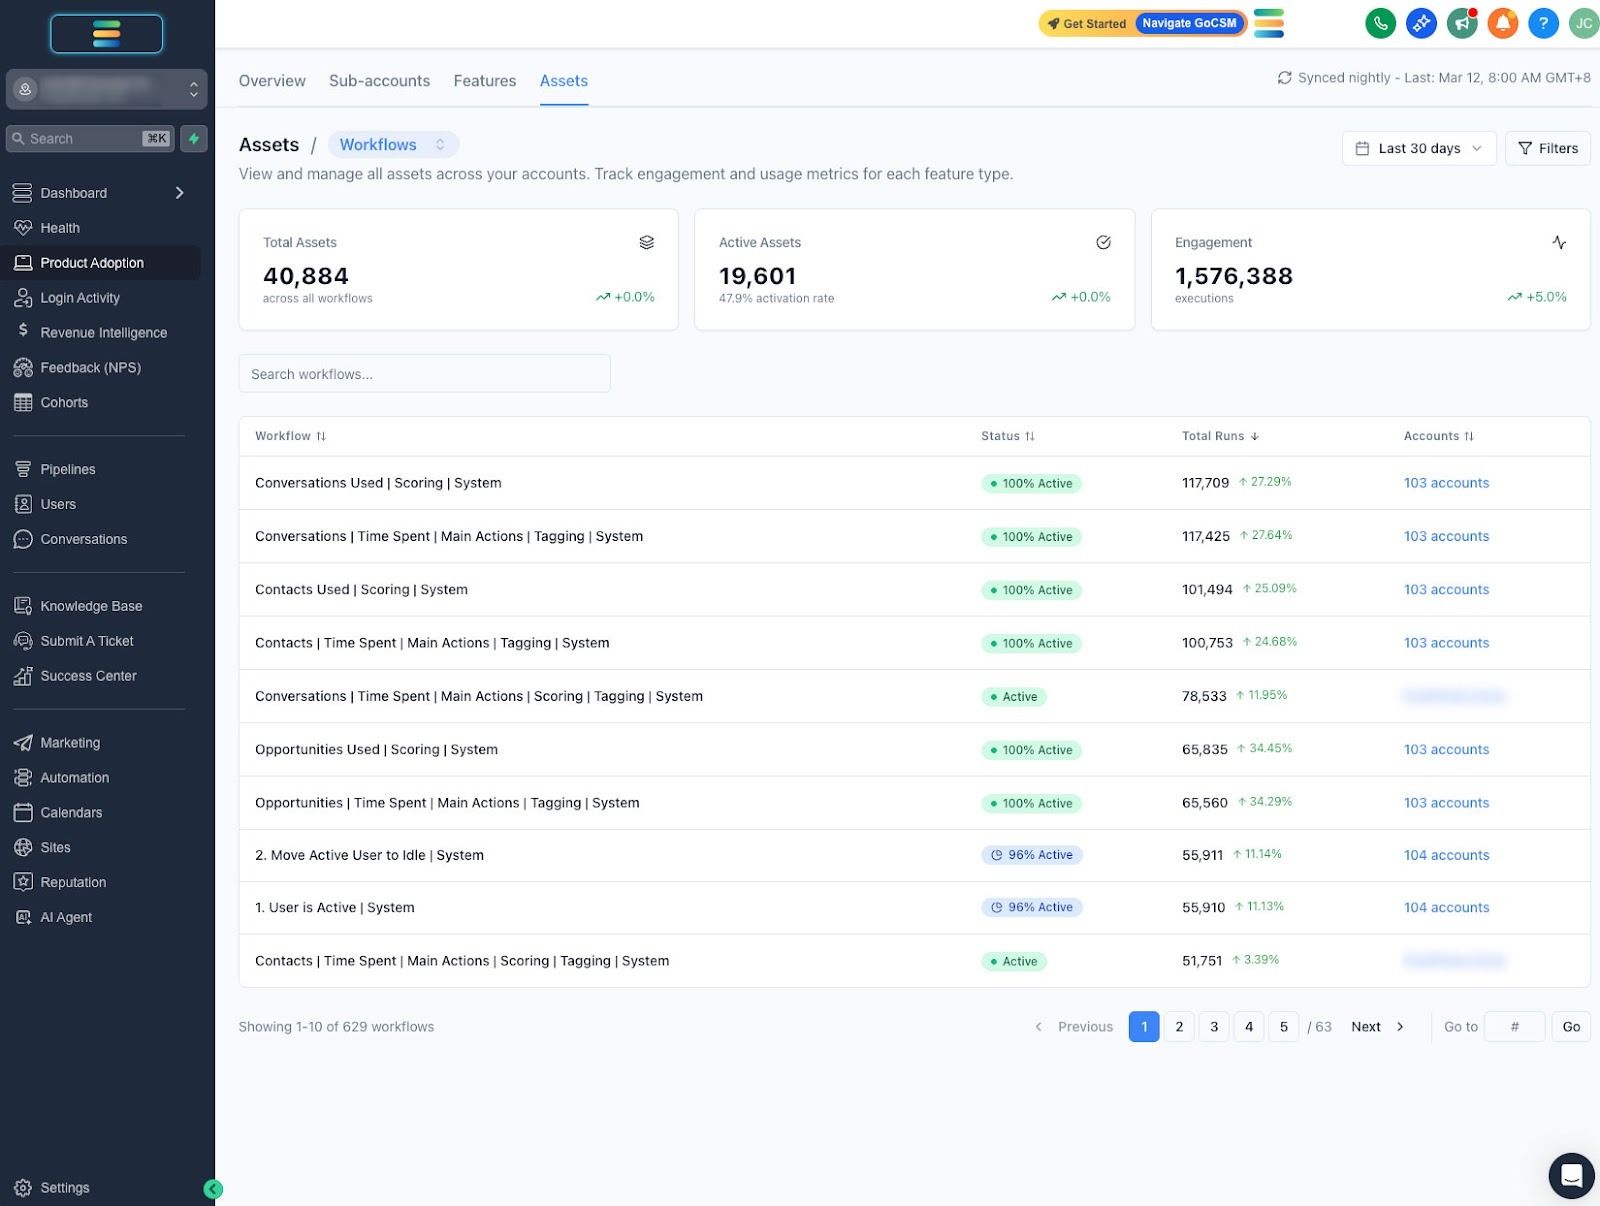
👉 Learn More About Product Adoption Assets
Key Features
🗺️ Four Specialized Views The dashboard is broken down into four navigable tabs: Overview, Sub-Accounts, Features, and Assets.
🎯 Comprehensive Feature Tracking We track adoption across 9 key product areas, including Workflows, Contacts, Payments, Calendars, Custom Menu Links, Conversations, Phone, SMS, and Email.
🔄 Nightly Data Sync Data is refreshed via a background process from GHL APIs daily, ensuring you have accurate, up-to-date metrics.
📅 Flexible Global Controls Use the global time range selector to view data across presets like "Last 30 days," "Quarter to Date," or use the custom date range picker for up to a 365-day span.
Why it Matters
Retention starts with adoption. By understanding exactly what your users are building, configuring, and utilizing, you can proactively intervene when an account stalls or confidently upsell when they are heavily engaged.
Need help with the New Product Adoption?
💬 Reach out or submit a ticket through our Chat Widget — we're here to help!