🔐 New: Login Activity Analytics page Now Available!
We’ve just released the all-new Login Activity Overview page — giving you powerful insights into user login patterns, engagement trends, and session behavior across your SaaS accounts.
🆕 What’s New
📈 Login Overview & Trends
Total Logins Today, This Week, and This Month
Track Inactive Users over time
Visualize login counts across weekly and monthly timelines
🧑💻 User-Level Insights
Login Logs Feed (Coming Soon) — Real-time list of logins with timestamps and sub-account info
Online Users Now (Coming Soon) — See who’s currently active and how long they've been logged in
User Status Breakdown (Coming Soon) — Pie chart of active vs inactive users
Average Session Duration (Coming Soon) — See how long users stay active per session
🔥 Engagement Patterns
Login Activity Trend — Compare active vs inactive user counts throughout the week/month
Hourly Login Intensity Heat-map (Coming Soon) — See which hours of the day have the highest user activity
📊 Inactivity Monitoring
Total inactive users and daily inactive breakdowns help you identify disengaged accounts fast

💡 Why This Matters
🚨 Detect Early Churn Signals: Spot inactive users before they drop off
📅 Optimize User Onboarding: Know when your users are logging in (and when they aren’t)
🧠 Boost Retention & Support: Prioritize accounts that need re-engagement
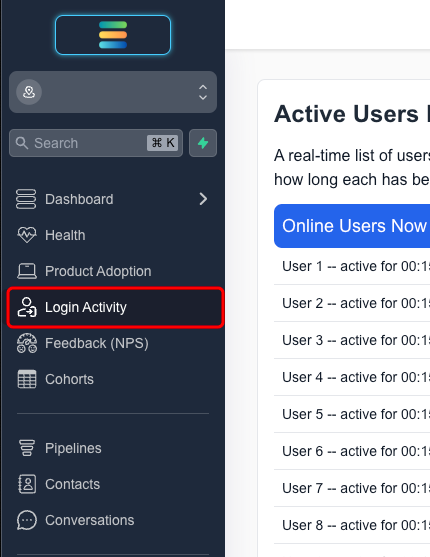
This dashboard is now live inside the Login Activity tab in your GoCSM account.
Some sections are marked as Coming Soon — stay tuned for real-time data views and log feeds!