📈 GoCSM Revenue Intelligence Overview – See your portfolio at a glance
The Overview tab puts all your revenue and cost data in one view so you can instantly understand how your business is performing.
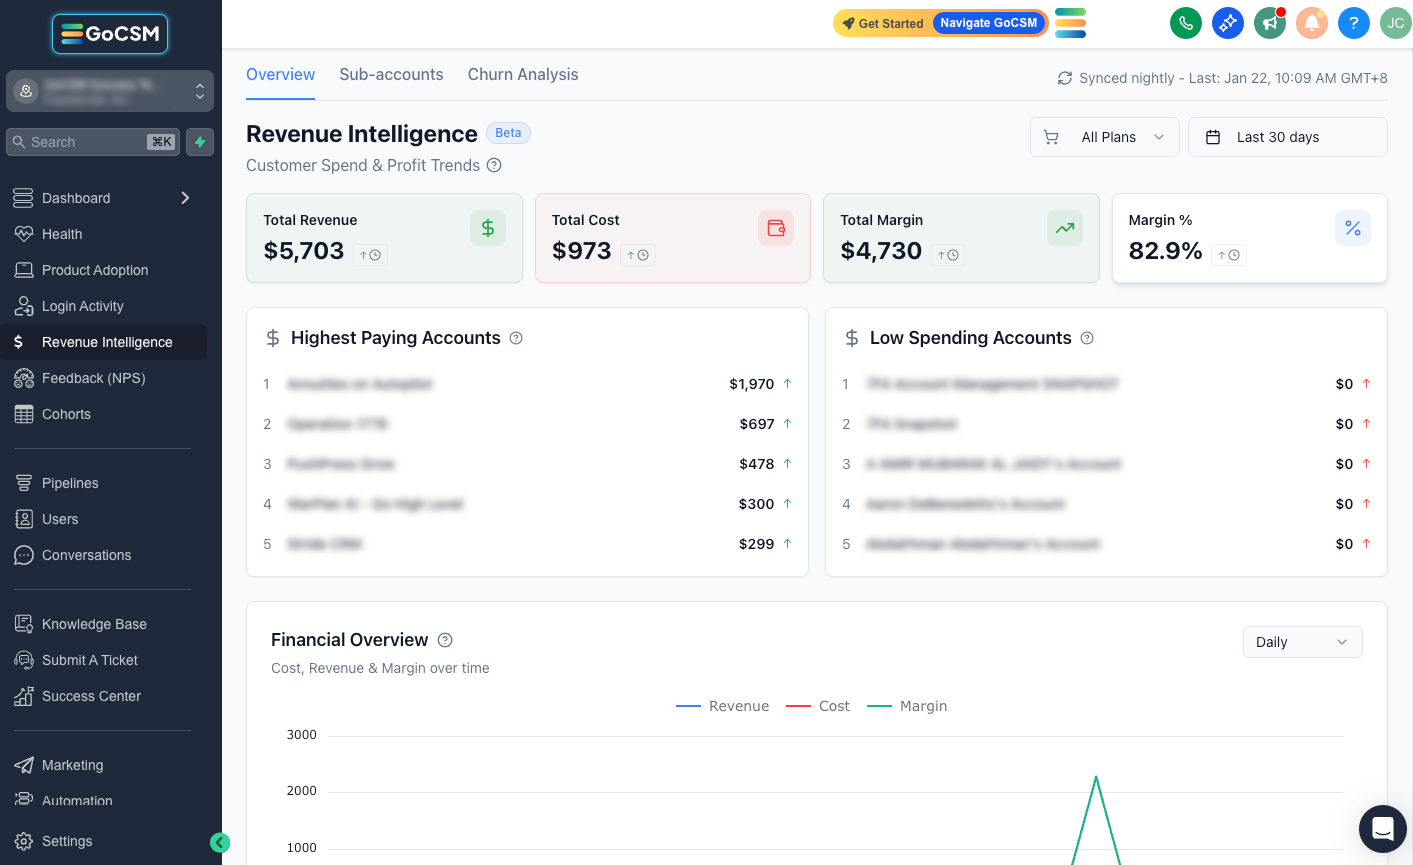
What’s New
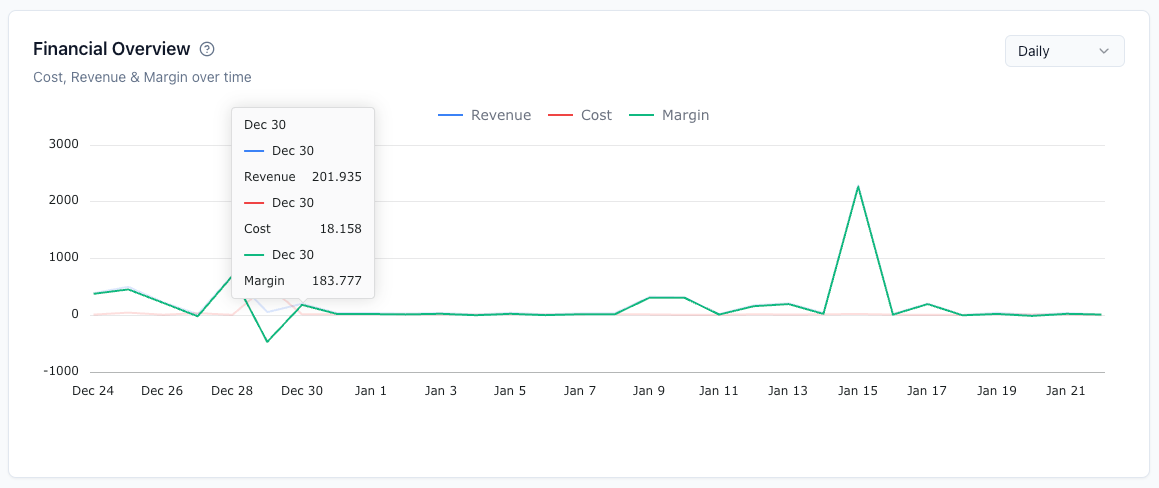
🧮 Financial Overview – Interactive line chart showing revenue, cost and margin over time with daily/weekly/monthly granularity.
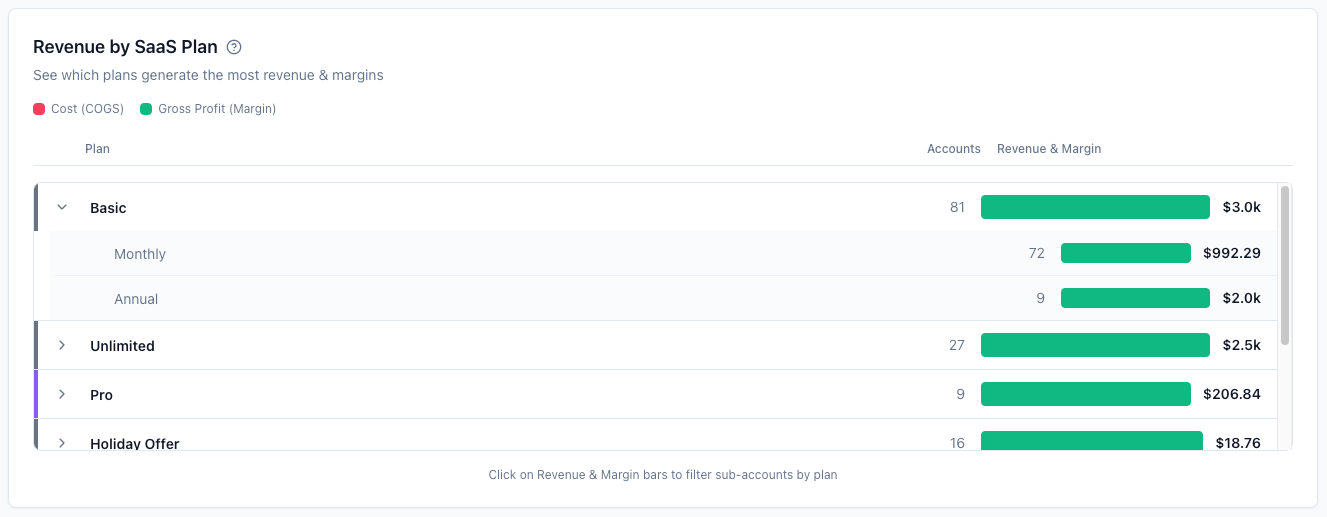
🧾 Revenue by SaaS Plan – Bar chart ranking each SaaS plan (Your Agency Plans in the SaaS Configurator V1/V2) by accounts and gross profit so you can see which tiers drive your revenue.
🧩 Revenue by add‑ons & re‑billing – Breakdown of SaaS subscriptions, add‑on subscriptions and usage‑based wallet items (e.g., SMS) with cost vs margin bars.
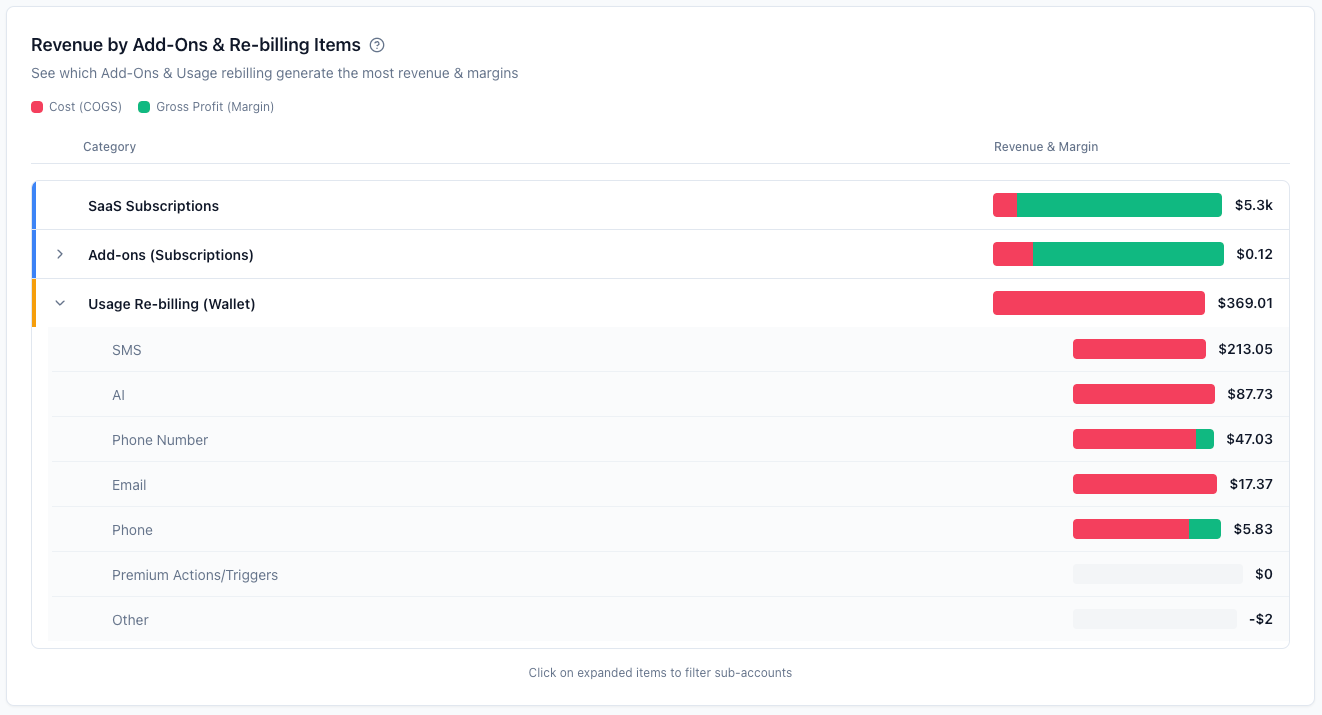
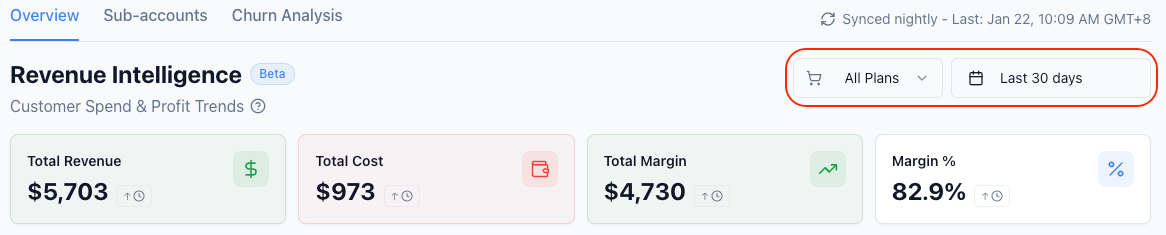
🔎 Adjust your view – Filter the entire Overview by plan or date range to compare month‑over‑month performance or zoom into specific segments. Expand categories to see individual add‑on or usage items for deeper insights.
Why This Matters
🔍 Instant visibility – Leaders can quickly gauge portfolio health without opening a spreadsheet or running a report.
🎯 Focus your efforts – Identify which plans and products produce the most profit so you can double down on what’s working.
📊 Data‑driven strategy – Track how revenue and cost structure change over time to inform pricing and investment decisions.
Check how Revenue Intelligence will work for you:
👉 https://docs.gocsm.com/en/articles/4978502
Need help with your Revenue Intelligence?
💬 Reach out or submit a ticket through our Chat Widget — we're here to help!